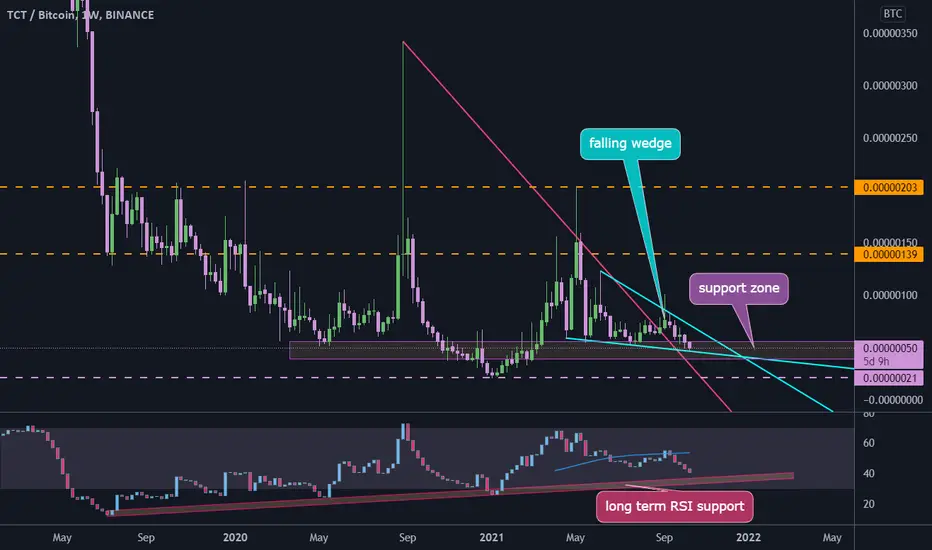
TCT falling wedge
#TCTBTC
#TCT with BTC pair shows a falling wedge pattern in daily time frame, we can see that price broke out from descending resistance line and going down near this line, there is a long term support zone in RSI that shows price may fall more to touch it one more time then head up and break the wedge pattern.
#TCT with BTC pair shows a falling wedge pattern in daily time frame, we can see that price broke out from descending resistance line and going down near this line, there is a long term support zone in RSI that shows price may fall more to touch it one more time then head up and break the wedge pattern.

Aviso legal
As informações e publicações não se destinam a ser, e não constituem, conselhos ou recomendações financeiras, de investimento, comerciais ou de outro tipo fornecidos ou endossados pela TradingView. Leia mais nos Termos de Uso.
Aviso legal
As informações e publicações não se destinam a ser, e não constituem, conselhos ou recomendações financeiras, de investimento, comerciais ou de outro tipo fornecidos ou endossados pela TradingView. Leia mais nos Termos de Uso.