
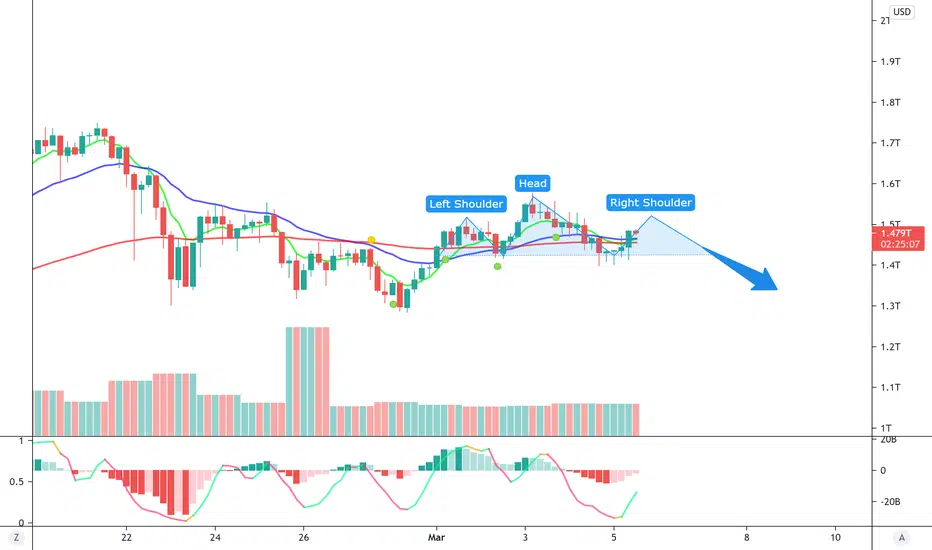
I can see a head and shoulders pattern forming looking at the Crypto Total Market Cap on the 4hr timeframe. There is also similar patterns going on with the BTC and ETH charts as well. The right shoulder on the BTC chart is approximately at the 50k mark. If we can see BTC holding above the 50k it will prove my head and shoulders theory was false. If not I see BTC dropping to the 40-42k range and the entire market cap revisiting the 1.2T mark. Last correction in mid January took approximately 22 days until the next run. Were about two weeks into this one. Again, my theory could be totally falsified and head the exact opposite direction. Crypto is at a big decision point so it's gonna make a move regardless. I'm with the bears on this one though.

Aviso legal
As informações e publicações não se destinam a ser, e não constituem, conselhos ou recomendações financeiras, de investimento, comerciais ou de outro tipo fornecidos ou endossados pela TradingView. Leia mais nos Termos de Uso.
Aviso legal
As informações e publicações não se destinam a ser, e não constituem, conselhos ou recomendações financeiras, de investimento, comerciais ou de outro tipo fornecidos ou endossados pela TradingView. Leia mais nos Termos de Uso.