
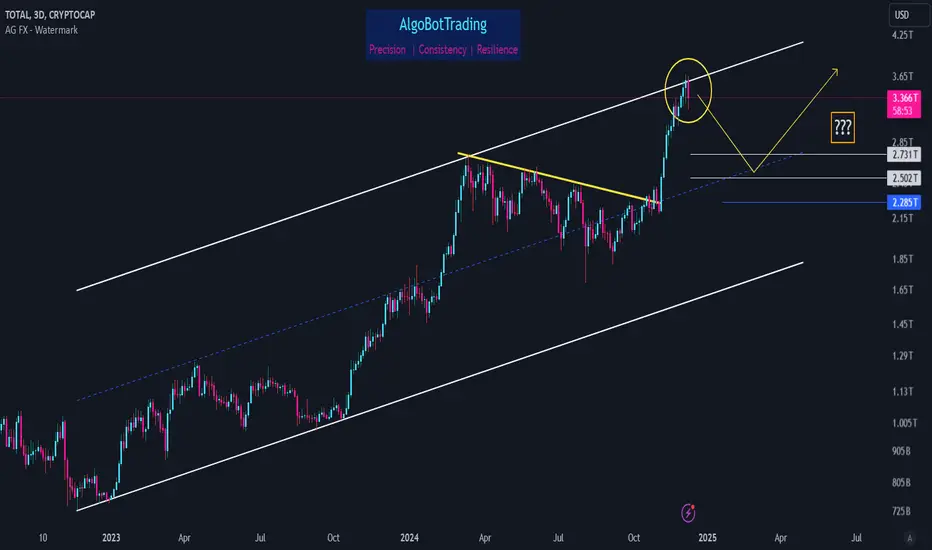
Sometimes a tool as simple as parallel channel can help us identify important support/resistance zones.
Looking at the chart, it's obvious that TOTAL reached 3.6T zone. Not only is this zone the area where a couple of fibs exist, but also it is indeed the upper boundary of the long term ascending channel.
Higher possibility scenario is to see a drop towards 2.5T - 2.73T zone before continuing the rally towards higher level. In order to keep its bullish integrity, TOTAL must not drop below 2.28T level.

Aviso legal
As informações e publicações não se destinam a ser, e não constituem, conselhos ou recomendações financeiras, de investimento, comerciais ou de outro tipo fornecidos ou endossados pela TradingView. Leia mais nos Termos de Uso.
Aviso legal
As informações e publicações não se destinam a ser, e não constituem, conselhos ou recomendações financeiras, de investimento, comerciais ou de outro tipo fornecidos ou endossados pela TradingView. Leia mais nos Termos de Uso.