
As traders, we're constantly walking a tightrope between embracing the opportunities that volatility creates and resisting the temptation to react emotionally to large price swings. Few markets have illustrated that balancing act better in recent months than oil.
Volatility is useful. Without movement, participation and expanding ranges, there is very little to trade. But volatility also changes the emotional temperature of the market. Large candles create urgency. Headlines make price action feel more important. Breakouts and breakdowns can suddenly look obvious.
The challenge is not simply identifying whether oil is bullish or bearish. It is recognising when the market is offering a high-quality opportunity and when it is simply encouraging us to react.
When Volatility Is Driving Your Decision
High volatility is not the problem. Reacting because volatility is high is the problem.
If you were not prepared to buy oil five minutes ago, one large candle should not automatically change that view. The question is whether the setup has genuinely improved.
Has structure improved?
Has confirmation improved?
Has the risk/reward improved?
Or has price simply moved quickly enough to create fear of missing out?
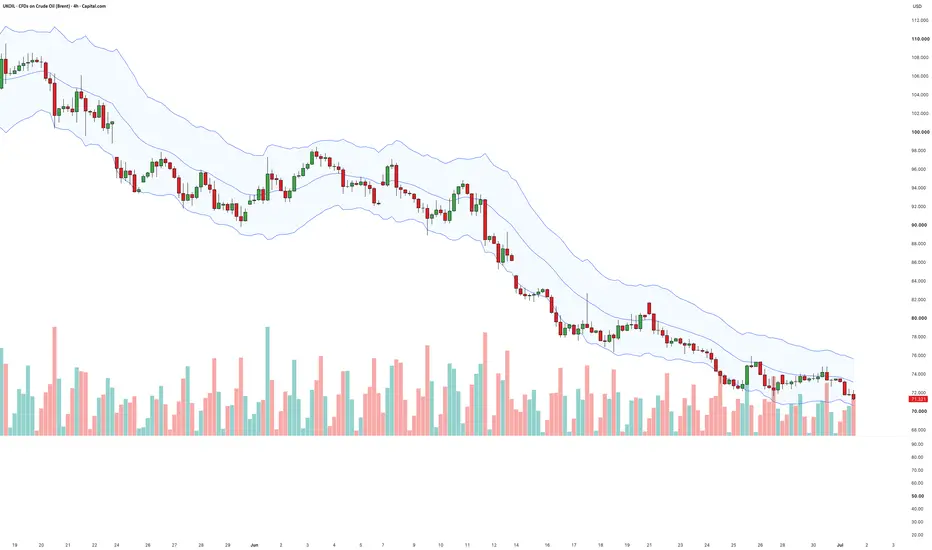
The following examples use the four-hour candle chart. This timeframe removes some of the intraday noise while still capturing the behaviour around major news-driven moves. It allows us to focus less on the individual headline and more on how price behaved once the initial emotion began to settle.
UKOIL Four-Hour Candle Chart

Past performance is not a reliable indicator of future results
In this first example, UKOIL accelerates sharply higher following a news-driven push and moves well above the upper Keltner Channel.
At first glance, the move looks incredibly bullish. Momentum is strong, price is expanding and the temptation is to chase before the opportunity disappears.
But this is where the quality of the trade has already started to deteriorate.
Buying after several impulsive candles often requires a wider stop-loss, while much of the immediate upside has already been captured. The trend may have become stronger, but the trade has become weaker.
Notice what happened next. Price did not collapse. The broader bullish structure remained intact. But UKOIL rotated back towards its average, giving patient traders a cleaner opportunity with a more favourable risk/reward profile.
The Keltner Channel is not being used here as a standalone trading signal. It simply helps visualise when price has become unusually extended relative to its recent average.
When The News Is Driving Your Decision
Oil headlines can be powerful, but the headline itself is rarely enough.
Markets move on the gap between expectation and reality. By the time a story reaches your screen, a lot of the positioning adjustment may already have taken place.
That is why the important question is not simply whether the news sounds bullish or bearish.
The better question is how price reacts.
Does bullish news still attract fresh buying?
Does bearish news still attract fresh selling?
Or is the market beginning to tell a different story?
This is particularly important in oil because the headlines can remain dramatic even after price has already adjusted. A market can stop rising while the news still sounds bullish. It can also stop falling while the headlines remain negative.
That is not the chart ignoring the news. It is the chart showing that expectations may already have moved.
When Price Action Is Driving Your Decision
Price action matters, but obvious price action can also be dangerous.
A clean break of support or resistance feels reassuring because it gives traders something simple to act on. The level breaks, the signal looks clear and the decision feels easier.
But in a fast-moving, news-driven market like oil, the first break is not always the real move.
UKOIL Four-Hour Candle Chart

Past performance is not a reliable indicator of future results
This second example shows UKOIL breaking below a clear swing support level. On the initial move, the breakdown appears to confirm a fresh bearish phase.
For traders selling the break, the signal looks clean.
But price quickly reverses, reclaiming the broken level and trapping sellers on the wrong side of the market.
This does not mean every breakdown should be faded. It means obvious levels deserve context. During periods of heightened volatility, support and resistance can become liquidity areas rather than simple decision points. A temporary move through a level can trigger stops, attract breakout traders and create the conditions for a reversal.
Sometimes patience gives you a better entry.
Sometimes it simply keeps you out of a poor trade.
The Bottom Line
Oil can offer excellent trading opportunities, but it also has a habit of making poor decisions feel urgent.
The biggest candle...
The strongest headline...
The cleanest break...
These are often the moments where discipline matters most.
The next time UKOIL makes a dramatic move, ask yourself one question:
Has the opportunity genuinely improved, or has only the emotion increased?
That question will not prevent every losing trade. But it can help you avoid some of the lowest-quality ones.
Disclaimer: This is for information and learning purposes only. The information provided does not constitute investment advice nor take into account the individual financial circumstances or objectives of any investor. Any information that may be provided relating to past performance is not a reliable indicator of future results or performance. Social media channels are not relevant for UK residents.
Spread bets and CFDs are complex instruments and come with a high risk of losing money rapidly due to leverage. 89% of retail investor accounts lose money when trading spread bets and CFDs with this provider. You should consider whether you understand how spread bets and CFDs work and whether you can afford to take the high risk of losing your money.
Volatility is useful. Without movement, participation and expanding ranges, there is very little to trade. But volatility also changes the emotional temperature of the market. Large candles create urgency. Headlines make price action feel more important. Breakouts and breakdowns can suddenly look obvious.
The challenge is not simply identifying whether oil is bullish or bearish. It is recognising when the market is offering a high-quality opportunity and when it is simply encouraging us to react.
When Volatility Is Driving Your Decision
High volatility is not the problem. Reacting because volatility is high is the problem.
If you were not prepared to buy oil five minutes ago, one large candle should not automatically change that view. The question is whether the setup has genuinely improved.
Has structure improved?
Has confirmation improved?
Has the risk/reward improved?
Or has price simply moved quickly enough to create fear of missing out?
The following examples use the four-hour candle chart. This timeframe removes some of the intraday noise while still capturing the behaviour around major news-driven moves. It allows us to focus less on the individual headline and more on how price behaved once the initial emotion began to settle.
UKOIL Four-Hour Candle Chart
Past performance is not a reliable indicator of future results
In this first example, UKOIL accelerates sharply higher following a news-driven push and moves well above the upper Keltner Channel.
At first glance, the move looks incredibly bullish. Momentum is strong, price is expanding and the temptation is to chase before the opportunity disappears.
But this is where the quality of the trade has already started to deteriorate.
Buying after several impulsive candles often requires a wider stop-loss, while much of the immediate upside has already been captured. The trend may have become stronger, but the trade has become weaker.
Notice what happened next. Price did not collapse. The broader bullish structure remained intact. But UKOIL rotated back towards its average, giving patient traders a cleaner opportunity with a more favourable risk/reward profile.
The Keltner Channel is not being used here as a standalone trading signal. It simply helps visualise when price has become unusually extended relative to its recent average.
When The News Is Driving Your Decision
Oil headlines can be powerful, but the headline itself is rarely enough.
Markets move on the gap between expectation and reality. By the time a story reaches your screen, a lot of the positioning adjustment may already have taken place.
That is why the important question is not simply whether the news sounds bullish or bearish.
The better question is how price reacts.
Does bullish news still attract fresh buying?
Does bearish news still attract fresh selling?
Or is the market beginning to tell a different story?
This is particularly important in oil because the headlines can remain dramatic even after price has already adjusted. A market can stop rising while the news still sounds bullish. It can also stop falling while the headlines remain negative.
That is not the chart ignoring the news. It is the chart showing that expectations may already have moved.
When Price Action Is Driving Your Decision
Price action matters, but obvious price action can also be dangerous.
A clean break of support or resistance feels reassuring because it gives traders something simple to act on. The level breaks, the signal looks clear and the decision feels easier.
But in a fast-moving, news-driven market like oil, the first break is not always the real move.
UKOIL Four-Hour Candle Chart
Past performance is not a reliable indicator of future results
This second example shows UKOIL breaking below a clear swing support level. On the initial move, the breakdown appears to confirm a fresh bearish phase.
For traders selling the break, the signal looks clean.
But price quickly reverses, reclaiming the broken level and trapping sellers on the wrong side of the market.
This does not mean every breakdown should be faded. It means obvious levels deserve context. During periods of heightened volatility, support and resistance can become liquidity areas rather than simple decision points. A temporary move through a level can trigger stops, attract breakout traders and create the conditions for a reversal.
Sometimes patience gives you a better entry.
Sometimes it simply keeps you out of a poor trade.
The Bottom Line
Oil can offer excellent trading opportunities, but it also has a habit of making poor decisions feel urgent.
The biggest candle...
The strongest headline...
The cleanest break...
These are often the moments where discipline matters most.
The next time UKOIL makes a dramatic move, ask yourself one question:
Has the opportunity genuinely improved, or has only the emotion increased?
That question will not prevent every losing trade. But it can help you avoid some of the lowest-quality ones.
Disclaimer: This is for information and learning purposes only. The information provided does not constitute investment advice nor take into account the individual financial circumstances or objectives of any investor. Any information that may be provided relating to past performance is not a reliable indicator of future results or performance. Social media channels are not relevant for UK residents.
Spread bets and CFDs are complex instruments and come with a high risk of losing money rapidly due to leverage. 89% of retail investor accounts lose money when trading spread bets and CFDs with this provider. You should consider whether you understand how spread bets and CFDs work and whether you can afford to take the high risk of losing your money.

Aviso legal
As informações e publicações não se destinam a ser, e não constituem, conselhos ou recomendações financeiras, de investimento, comerciais ou de outro tipo fornecidos ou endossados pela TradingView. Leia mais nos Termos de Uso.
Aviso legal
As informações e publicações não se destinam a ser, e não constituem, conselhos ou recomendações financeiras, de investimento, comerciais ou de outro tipo fornecidos ou endossados pela TradingView. Leia mais nos Termos de Uso.