
# UPST (Upstart Holdings Inc.) Daily Chart Analysis – 6/1/26
### Company Information
Upstart Holdings operates an AI-driven lending platform that helps financial institutions evaluate borrowers using machine learning models. UPST remains one of the more volatile AI and fintech-related stocks in the market.
### Key Observations
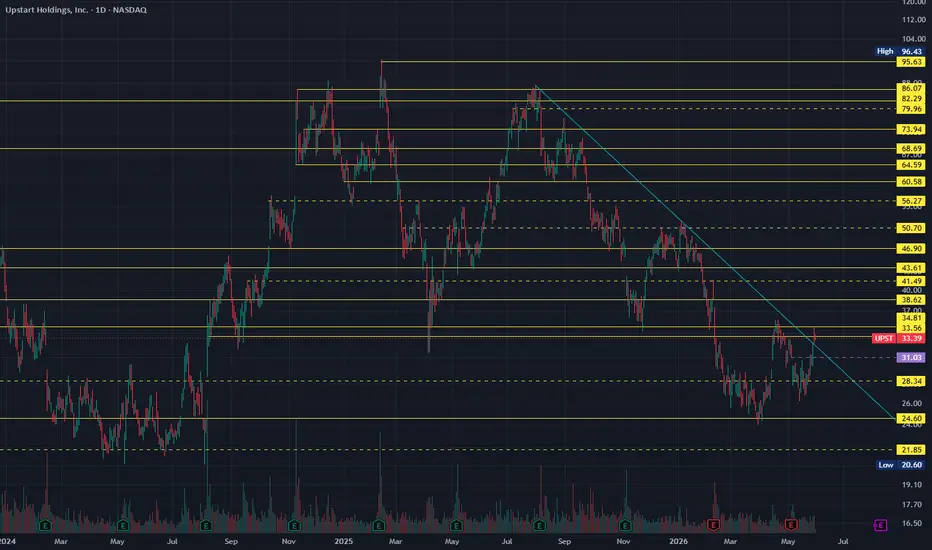
• UPST has been in a prolonged downtrend since the August 2025 highs near $86.
• The stock recently found support near the major historical demand zone between:
• $24.60
• $28.34
• Price has started to build a series of higher lows since the March bottom, suggesting selling pressure may be easing.
• The descending trendline from the 2025 highs remains the most important technical level on the chart.
• Current price action is sitting directly beneath trendline resistance, making the next move particularly important.
### Pattern Structure
• Multi-month descending trendline remains intact.
• Potential trend reversal is developing if buyers can break above:
• $33.56
• The descending trendline
• The stock appears to be transitioning from a bearish trend into a possible base-building phase.
• A successful breakout would create the first meaningful higher-high sequence seen in many months.
### Support & Resistance Levels
#### Resistance
• $33.56
• $38.62
• $41.49
• $43.61
• $46.90
• $50.70
• $56.27
#### Support
• $31.03
• $28.34
• $24.60
• $21.85
### Volume & Trend Notes
• Volume has remained relatively stable during the recent consolidation, which is constructive after the large decline.
• The stock has repeatedly defended the mid-$20s area, creating a potentially important accumulation zone.
• Buyers are now attempting to reclaim higher levels while compressing directly under descending trendline resistance.
• A breakout through the trendline would likely attract momentum traders back into the name.
### ✅ Trading Plan
#### Bullish Scenario
Trigger: Break and hold above $33.56 and the descending trendline
Targets:
• PT1: $38.62
• PT2: $41.49
• PT3: $43.61
• PT4: $46.90
• PT5: $50.70
Stop Loss:
• Close below $31.03
#### Bearish Scenario
Trigger: Rejection at trendline resistance and loss of $31.03
Targets:
• PT1: $28.34
• PT2: $24.60
• PT3: $21.85
Stop Loss:
• Reclaim above $33.56
### Summary
UPST is approaching a major decision point. After months of selling pressure, the stock has begun building a base above the $24-$28 support zone and is now testing a key descending trendline. A breakout above $33.56 would significantly improve the technical picture and could open the door toward the upper $30s and low $40s. Until that breakout occurs, the stock remains in a recovery attempt, but the chart is looking considerably healthier than it did just a few months ago.
### Company Information
Upstart Holdings operates an AI-driven lending platform that helps financial institutions evaluate borrowers using machine learning models. UPST remains one of the more volatile AI and fintech-related stocks in the market.
### Key Observations
• UPST has been in a prolonged downtrend since the August 2025 highs near $86.
• The stock recently found support near the major historical demand zone between:
• $24.60
• $28.34
• Price has started to build a series of higher lows since the March bottom, suggesting selling pressure may be easing.
• The descending trendline from the 2025 highs remains the most important technical level on the chart.
• Current price action is sitting directly beneath trendline resistance, making the next move particularly important.
### Pattern Structure
• Multi-month descending trendline remains intact.
• Potential trend reversal is developing if buyers can break above:
• $33.56
• The descending trendline
• The stock appears to be transitioning from a bearish trend into a possible base-building phase.
• A successful breakout would create the first meaningful higher-high sequence seen in many months.
### Support & Resistance Levels
#### Resistance
• $33.56
• $38.62
• $41.49
• $43.61
• $46.90
• $50.70
• $56.27
#### Support
• $31.03
• $28.34
• $24.60
• $21.85
### Volume & Trend Notes
• Volume has remained relatively stable during the recent consolidation, which is constructive after the large decline.
• The stock has repeatedly defended the mid-$20s area, creating a potentially important accumulation zone.
• Buyers are now attempting to reclaim higher levels while compressing directly under descending trendline resistance.
• A breakout through the trendline would likely attract momentum traders back into the name.
### ✅ Trading Plan
#### Bullish Scenario
Trigger: Break and hold above $33.56 and the descending trendline
Targets:
• PT1: $38.62
• PT2: $41.49
• PT3: $43.61
• PT4: $46.90
• PT5: $50.70
Stop Loss:
• Close below $31.03
#### Bearish Scenario
Trigger: Rejection at trendline resistance and loss of $31.03
Targets:
• PT1: $28.34
• PT2: $24.60
• PT3: $21.85
Stop Loss:
• Reclaim above $33.56
### Summary
UPST is approaching a major decision point. After months of selling pressure, the stock has begun building a base above the $24-$28 support zone and is now testing a key descending trendline. A breakout above $33.56 would significantly improve the technical picture and could open the door toward the upper $30s and low $40s. Until that breakout occurs, the stock remains in a recovery attempt, but the chart is looking considerably healthier than it did just a few months ago.

Aviso legal
As informações e publicações não se destinam a ser, e não constituem, conselhos ou recomendações financeiras, de investimento, comerciais ou de outro tipo fornecidos ou endossados pela TradingView. Leia mais nos Termos de Uso.
Aviso legal
As informações e publicações não se destinam a ser, e não constituem, conselhos ou recomendações financeiras, de investimento, comerciais ou de outro tipo fornecidos ou endossados pela TradingView. Leia mais nos Termos de Uso.