
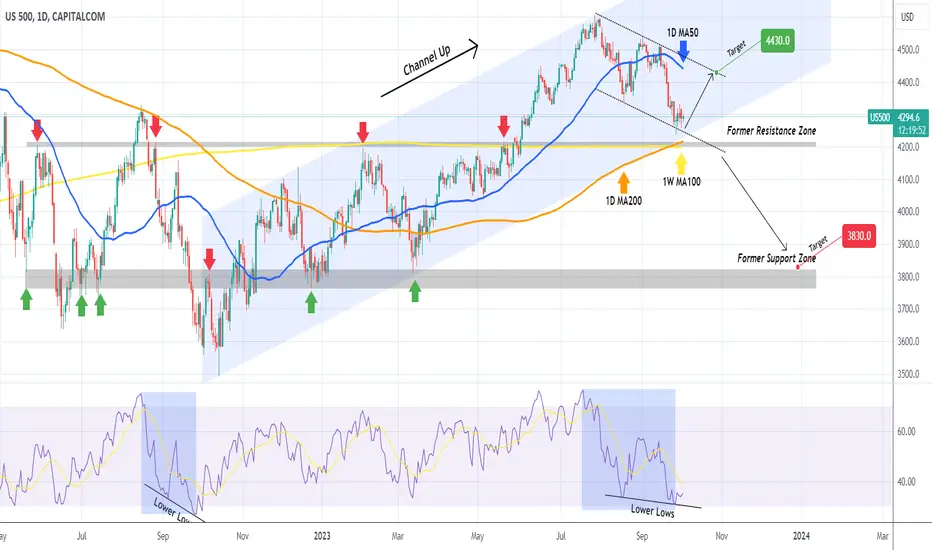
The S&P500 (SPX) is testing the bottom (Higher Lows trend-line) of the 12-month Channel Up pattern. It is vital for the uptrend that the following Support Cluster holds, as if broken, the next Demand/ Support Zone is seen considerably lower, in the low 3800s.
Back to the Support Zone. Besides the bottom of the Channel Up, we have the 1D MA200 (orange trend-line) moving parallel to that and has been unbroken since March 24. More importantly, the 1W MA100 (yellow trend-line) a former Resistance turned into Support after May's break-out, is marginally below the 1D MA200 and on a former Resistance Zone, which in the past 18 months, only broken twice.
As long as the price closes 1D candles above this critical Support cluster, we expect a short-term (at least) rise to test the top of the Channel Down and the 1D MA50 (blue trend-line) at 4430. If the Support fails, expect a greater and perhaps quicker/ more aggressive decline towards 3830 and the former Support Zone.
Notice how the 1D RSI pattern resembles the August - September 2022 correction.
-------------------------------------------------------------------------------
** Please LIKE 👍, FOLLOW ✅, SHARE 🙌 and COMMENT ✍ if you enjoy this idea! Also share your ideas and charts in the comments section below! **
-------------------------------------------------------------------------------
💸💸💸💸💸💸
👇 👇 👇 👇 👇 👇
Back to the Support Zone. Besides the bottom of the Channel Up, we have the 1D MA200 (orange trend-line) moving parallel to that and has been unbroken since March 24. More importantly, the 1W MA100 (yellow trend-line) a former Resistance turned into Support after May's break-out, is marginally below the 1D MA200 and on a former Resistance Zone, which in the past 18 months, only broken twice.
As long as the price closes 1D candles above this critical Support cluster, we expect a short-term (at least) rise to test the top of the Channel Down and the 1D MA50 (blue trend-line) at 4430. If the Support fails, expect a greater and perhaps quicker/ more aggressive decline towards 3830 and the former Support Zone.
Notice how the 1D RSI pattern resembles the August - September 2022 correction.
-------------------------------------------------------------------------------
** Please LIKE 👍, FOLLOW ✅, SHARE 🙌 and COMMENT ✍ if you enjoy this idea! Also share your ideas and charts in the comments section below! **
-------------------------------------------------------------------------------
💸💸💸💸💸💸
👇 👇 👇 👇 👇 👇

I trade Crypto, Forex, Indices & Commodities on PrimeXBT — all from one account with TradingView charts 👉 tradingshot.short.gy/PrimeXBT
I also use TradeNation for fixed spreads & zero commission 👉 tradingshot.short.gy/Tradenation
I also use TradeNation for fixed spreads & zero commission 👉 tradingshot.short.gy/Tradenation
Aviso legal
As informações e publicações não se destinam a ser, e não constituem, conselhos ou recomendações financeiras, de investimento, comerciais ou de outro tipo fornecidos ou endossados pela TradingView. Leia mais nos Termos de Uso.
I trade Crypto, Forex, Indices & Commodities on PrimeXBT — all from one account with TradingView charts 👉 tradingshot.short.gy/PrimeXBT
I also use TradeNation for fixed spreads & zero commission 👉 tradingshot.short.gy/Tradenation
I also use TradeNation for fixed spreads & zero commission 👉 tradingshot.short.gy/Tradenation
Aviso legal
As informações e publicações não se destinam a ser, e não constituem, conselhos ou recomendações financeiras, de investimento, comerciais ou de outro tipo fornecidos ou endossados pela TradingView. Leia mais nos Termos de Uso.