

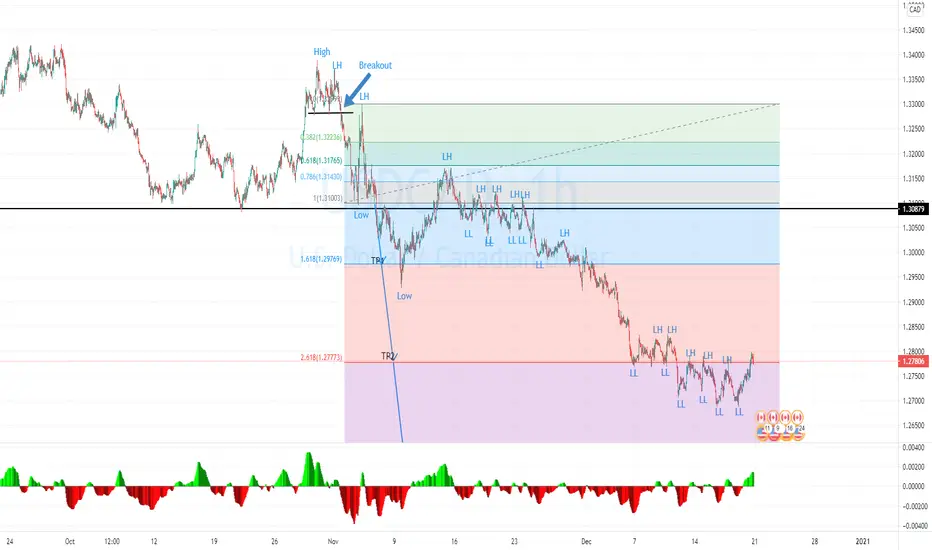
USDCAD on the 1H time-frame.
Steps:
1. The price still running downtrend by created the lower high and lower low.
2. The price already hit TP1: 1.29769 and TP2: 1.27773 at the Fibonacci level.
3. The next level is TP3: 1.25431 and 1.24546 at the support zone in Day time frame.
4. If the next MACD (-) create the higher low then there will be the 1st step of the reversal pattern.
Steps:
1. The price still running downtrend by created the lower high and lower low.
2. The price already hit TP1: 1.29769 and TP2: 1.27773 at the Fibonacci level.
3. The next level is TP3: 1.25431 and 1.24546 at the support zone in Day time frame.
4. If the next MACD (-) create the higher low then there will be the 1st step of the reversal pattern.

Aviso legal
As informações e publicações não se destinam a ser, e não constituem, conselhos ou recomendações financeiras, de investimento, comerciais ou de outro tipo fornecidos ou endossados pela TradingView. Leia mais nos Termos de Uso.
Aviso legal
As informações e publicações não se destinam a ser, e não constituem, conselhos ou recomendações financeiras, de investimento, comerciais ou de outro tipo fornecidos ou endossados pela TradingView. Leia mais nos Termos de Uso.