

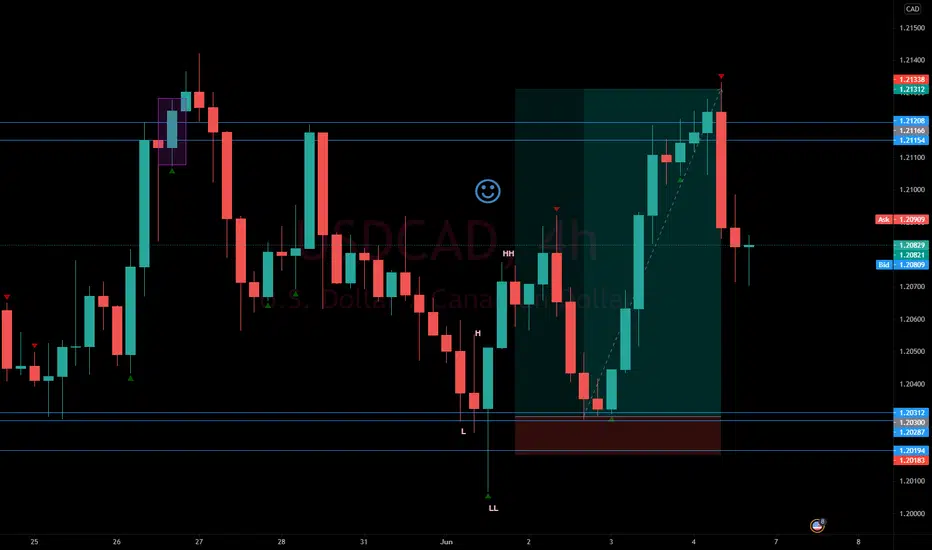
The reason for my entry is to find supply and demand area on H4 timeframe. Mark the area, proceed to lower timeframe. Find any possible setup, in this case there is a quasimodo reversal pattern. L H LL HH. Hence, mark the base on L. SL is based on lowest support under line chart. Tp would be on where you mark H or HH. But in this case the chart gave us more than what our original target would be.

Aviso legal
As informações e publicações não se destinam a ser, e não constituem, conselhos ou recomendações financeiras, de investimento, comerciais ou de outro tipo fornecidos ou endossados pela TradingView. Leia mais nos Termos de Uso.
Aviso legal
As informações e publicações não se destinam a ser, e não constituem, conselhos ou recomendações financeiras, de investimento, comerciais ou de outro tipo fornecidos ou endossados pela TradingView. Leia mais nos Termos de Uso.