

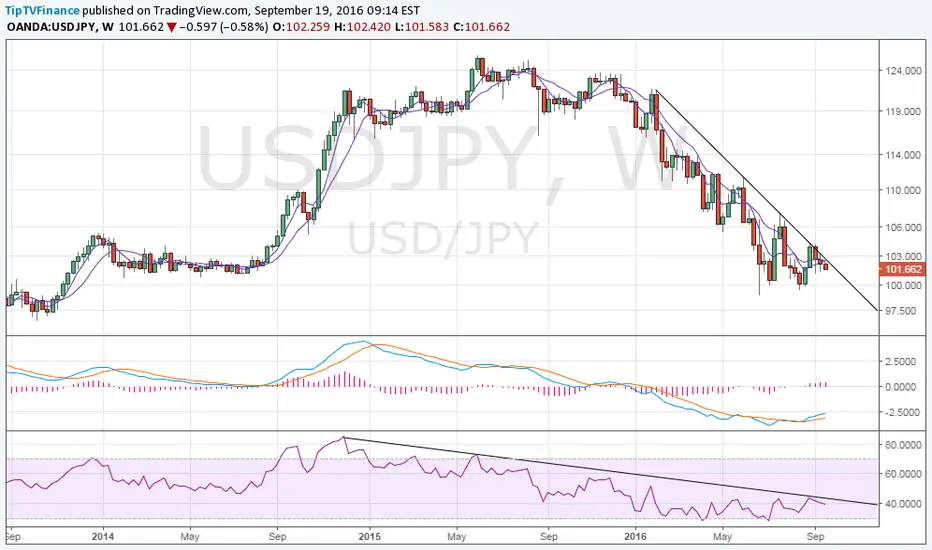
Weekly chart shows the descending trend line on the price chart and RSI is very much intact.
However, note the repeated rebound from near 99-100 levels and the bullish crossover between MACD lines.
Hence, the odds of the pair breaching the descending trendline are high and a much safer short trade would be below 100.00 levels.
However, note the repeated rebound from near 99-100 levels and the bullish crossover between MACD lines.
Hence, the odds of the pair breaching the descending trendline are high and a much safer short trade would be below 100.00 levels.

Publicações relacionadas
Aviso legal
As informações e publicações não se destinam a ser, e não constituem, conselhos ou recomendações financeiras, de investimento, comerciais ou de outro tipo fornecidos ou endossados pela TradingView. Leia mais nos Termos de Uso.
Publicações relacionadas
Aviso legal
As informações e publicações não se destinam a ser, e não constituem, conselhos ou recomendações financeiras, de investimento, comerciais ou de outro tipo fornecidos ou endossados pela TradingView. Leia mais nos Termos de Uso.