
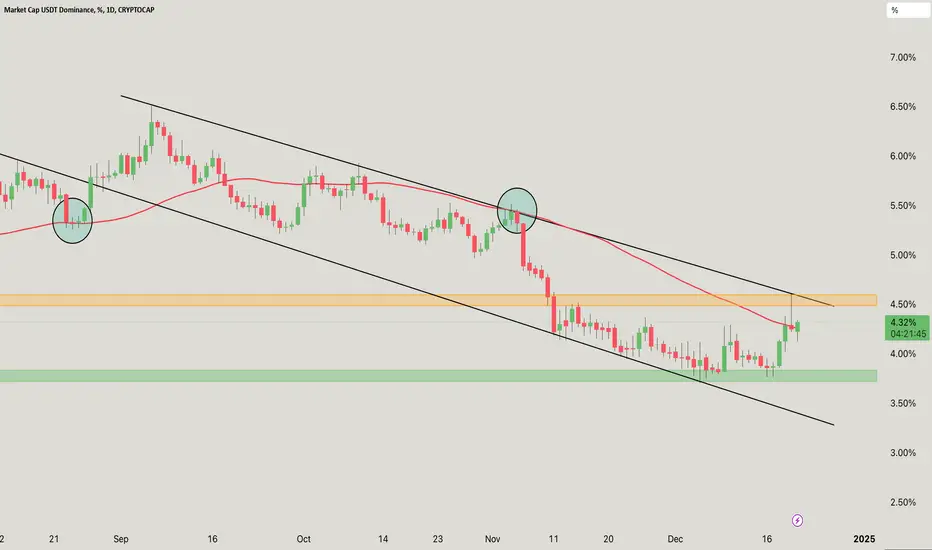
Reaction level: 4.60%
This area acts as a key overhead resistance, highlighted by price rejection at or near this previous level. A breakout above 4.60% would signal a change in momentum towards increasing USDT dominance.
Support area: 3.71%
This is a strong demand area where the price previously bounced. If the market returns to this level, it could provide crucial support and a potential reversal area.
The chart shows a clear descending channel with the price breaking or testing the upper boundary. This indicates a potential trend reversal or an attempt to move higher.
The price interacts with the moving average (possibly the 50-day MA), which has acted as resistance several times. Sustaining above the moving average would indicate bullish momentum.
DYOR, NFA
@Peter_CSAdmin

Publicações relacionadas
Aviso legal
As informações e publicações não se destinam a ser, e não constituem, conselhos ou recomendações financeiras, de investimento, comerciais ou de outro tipo fornecidos ou endossados pela TradingView. Leia mais nos Termos de Uso.
Publicações relacionadas
Aviso legal
As informações e publicações não se destinam a ser, e não constituem, conselhos ou recomendações financeiras, de investimento, comerciais ou de outro tipo fornecidos ou endossados pela TradingView. Leia mais nos Termos de Uso.