
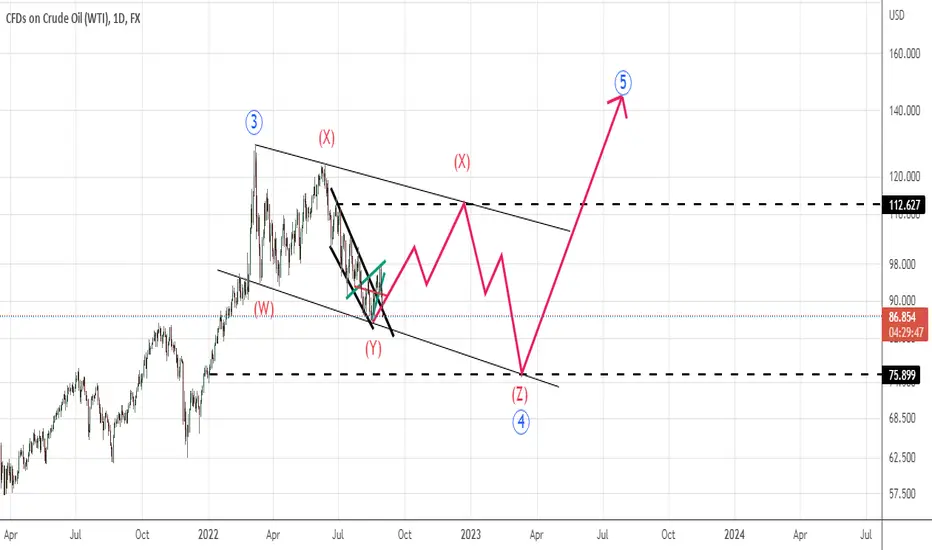
daily time frame wave count is a big picture of usoil wave sturcture as depicted on the chart indicating upward move toward 112-115 $ then going down for 75$ as these two numbers is taken from Kijensen and Tenkensen overlapped target and also our wolfe wave pattern and is in coincidence with USDCAD wave structure as below

if you have any comments about how you think for this analysis please share
thanks
if you have any comments about how you think for this analysis please share
thanks

Aviso legal
As informações e publicações não se destinam a ser, e não constituem, conselhos ou recomendações financeiras, de investimento, comerciais ou de outro tipo fornecidos ou endossados pela TradingView. Leia mais nos Termos de Uso.
Aviso legal
As informações e publicações não se destinam a ser, e não constituem, conselhos ou recomendações financeiras, de investimento, comerciais ou de outro tipo fornecidos ou endossados pela TradingView. Leia mais nos Termos de Uso.