
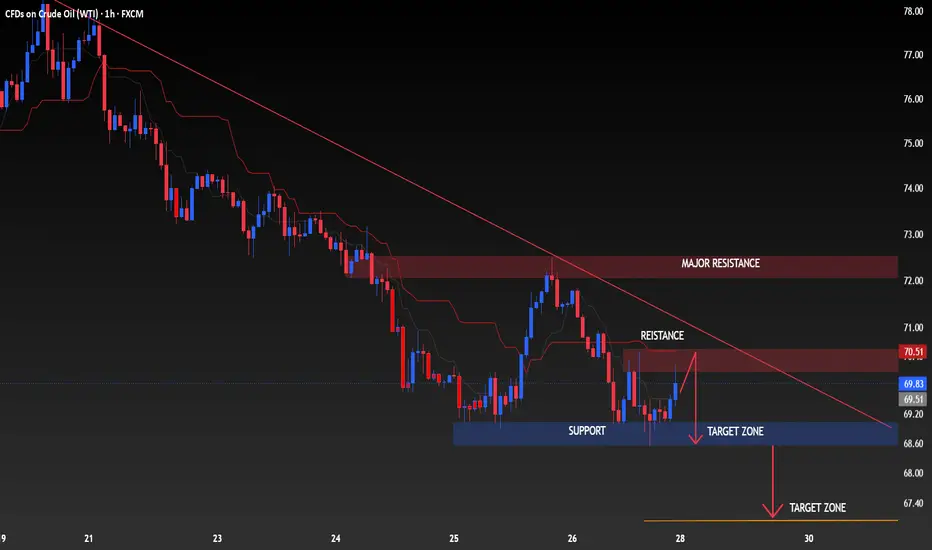
USOIL (WTI) – 1H Time Frame Analysis 📉 (Educational)
Current chart shows overall bearish structure with price trading below the descending trendline and reacting under resistance.
🔴 Sell Scenario (if rejection confirms):
📍 Entry Zone: 69.70 – 70.20
🎯 TP1: 68.60 (support / first target zone)
🎯 TP2: 67.40 (next target zone)
🎯 TP3: 66.50 (extended bearish move)
🛑 SL: Above 70.80 – 71.10
📌 Reasons:
• Price remains below major trendline
• Resistance zone still holding
• Lower highs structure active
• Bearish momentum still visible
⚠️ Wait for 1H candle confirmation before entry and manage risk (1–2%).
Caption:
“USOIL rejecting resistance — bearish continuation remains valid below trendline 📊🔥”
Current chart shows overall bearish structure with price trading below the descending trendline and reacting under resistance.
🔴 Sell Scenario (if rejection confirms):
📍 Entry Zone: 69.70 – 70.20
🎯 TP1: 68.60 (support / first target zone)
🎯 TP2: 67.40 (next target zone)
🎯 TP3: 66.50 (extended bearish move)
🛑 SL: Above 70.80 – 71.10
📌 Reasons:
• Price remains below major trendline
• Resistance zone still holding
• Lower highs structure active
• Bearish momentum still visible
⚠️ Wait for 1H candle confirmation before entry and manage risk (1–2%).
Caption:
“USOIL rejecting resistance — bearish continuation remains valid below trendline 📊🔥”
Trade ativo
active 
📲 Join telegram channel free .
t.me/addlist/7jtN1zcz9W05MDVk
Forex, Gold & Crypto Signals with detailed analysis & get consistent results.
Gold Signal's with proper TP & SL for high profit opportunities.
t.me/addlist/7jtN1zcz9W05MDVk
Forex, Gold & Crypto Signals with detailed analysis & get consistent results.
Gold Signal's with proper TP & SL for high profit opportunities.
Publicações relacionadas
Aviso legal
As informações e publicações não se destinam a ser, e não constituem, conselhos ou recomendações financeiras, de investimento, comerciais ou de outro tipo fornecidos ou endossados pela TradingView. Leia mais nos Termos de Uso.
📲 Join telegram channel free .
t.me/addlist/7jtN1zcz9W05MDVk
Forex, Gold & Crypto Signals with detailed analysis & get consistent results.
Gold Signal's with proper TP & SL for high profit opportunities.
t.me/addlist/7jtN1zcz9W05MDVk
Forex, Gold & Crypto Signals with detailed analysis & get consistent results.
Gold Signal's with proper TP & SL for high profit opportunities.
Publicações relacionadas
Aviso legal
As informações e publicações não se destinam a ser, e não constituem, conselhos ou recomendações financeiras, de investimento, comerciais ou de outro tipo fornecidos ou endossados pela TradingView. Leia mais nos Termos de Uso.