
NASDAQ — Multi-Timeframe Overview
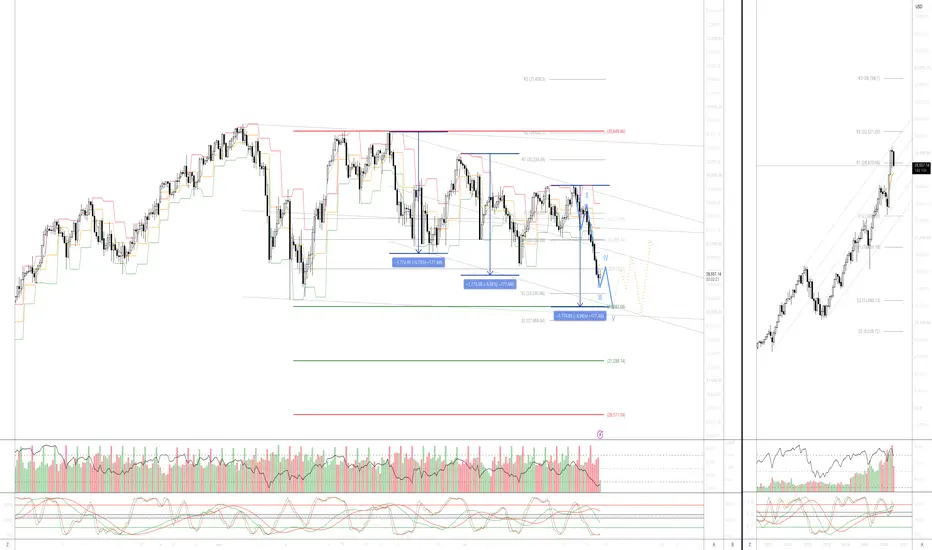
The H4 execution chart (left) shows a harmonic-driven decline resolving into a completing 5-wave Elliott impulse lower. Price rolled over from descending channel resistance and is unfolding in a clean five-wave sequence, with the measured Fib legs (blue boxes) stacking into progressively deeper targets. The harmonic symmetry of the swings—each leg respecting proportional Fib-measured moves—is guiding price toward the broader equality objective near the 28K zone. Critically, this final wave-5 extension is projected to sweep liquidity beneath the prior major swing low, a classic stop-run that often marks the exhaustion point of a corrective sequence. With momentum rolling over in confluence, the setup points toward downside exhaustion and a bullish reversal reaction once that terminal target is tagged and sub-swing-low liquidity is taken.
The higher-timeframe chart (right) remains constructively bullish, riding its rising channel with higher highs and higher lows intact near the upper Fib band. The H4 flush into 28K reads as a corrective liquidity sweep within the larger uptrend, not a structural break. As long as HTF channel support and the prior higher-low framework hold, the dominant bias stays up—reinforcing the case that the wave-5 sweep is a buy-the-dip liquidity event rather than the beginning of a trend reversal.
The Nasdaq is potentially completing a harmonic five-wave decline into the 28K equality objective, engineered to sweep liquidity below the prior major swing low, then align back with the bullish higher-timeframe trend. The highest-probability path is liquidity grab → downside exhaustion → bullish reversal, with invalidation only triggered on a sustained HTF break of channel support should the sweep fail to reclaim.
The H4 execution chart (left) shows a harmonic-driven decline resolving into a completing 5-wave Elliott impulse lower. Price rolled over from descending channel resistance and is unfolding in a clean five-wave sequence, with the measured Fib legs (blue boxes) stacking into progressively deeper targets. The harmonic symmetry of the swings—each leg respecting proportional Fib-measured moves—is guiding price toward the broader equality objective near the 28K zone. Critically, this final wave-5 extension is projected to sweep liquidity beneath the prior major swing low, a classic stop-run that often marks the exhaustion point of a corrective sequence. With momentum rolling over in confluence, the setup points toward downside exhaustion and a bullish reversal reaction once that terminal target is tagged and sub-swing-low liquidity is taken.
The higher-timeframe chart (right) remains constructively bullish, riding its rising channel with higher highs and higher lows intact near the upper Fib band. The H4 flush into 28K reads as a corrective liquidity sweep within the larger uptrend, not a structural break. As long as HTF channel support and the prior higher-low framework hold, the dominant bias stays up—reinforcing the case that the wave-5 sweep is a buy-the-dip liquidity event rather than the beginning of a trend reversal.
The Nasdaq is potentially completing a harmonic five-wave decline into the 28K equality objective, engineered to sweep liquidity below the prior major swing low, then align back with the bullish higher-timeframe trend. The highest-probability path is liquidity grab → downside exhaustion → bullish reversal, with invalidation only triggered on a sustained HTF break of channel support should the sweep fail to reclaim.

Join Now and Unlock Your Free TradingView Subscription: tickmill.link/3RKXvWm
This analysis is provided as general market commentary and does not constitute investment advice. Past performance is not indicative of future results
This analysis is provided as general market commentary and does not constitute investment advice. Past performance is not indicative of future results
Aviso legal
As informações e publicações não se destinam a ser, e não constituem, conselhos ou recomendações financeiras, de investimento, comerciais ou de outro tipo fornecidos ou endossados pela TradingView. Leia mais nos Termos de Uso.
Join Now and Unlock Your Free TradingView Subscription: tickmill.link/3RKXvWm
This analysis is provided as general market commentary and does not constitute investment advice. Past performance is not indicative of future results
This analysis is provided as general market commentary and does not constitute investment advice. Past performance is not indicative of future results
Aviso legal
As informações e publicações não se destinam a ser, e não constituem, conselhos ou recomendações financeiras, de investimento, comerciais ou de outro tipo fornecidos ou endossados pela TradingView. Leia mais nos Termos de Uso.