Long
VIBE breakout ?
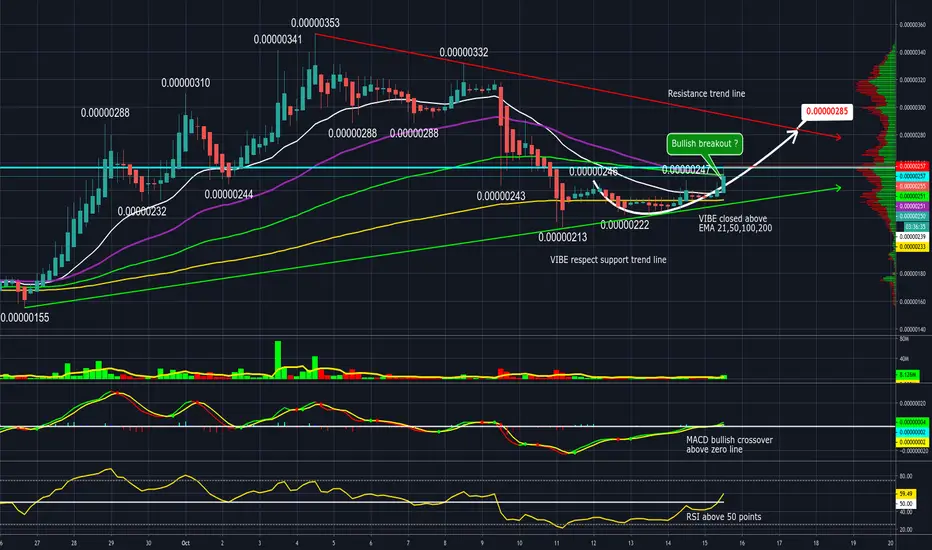
VIBE hold strong above support green trend line. Price Action above EMA 21,50,100,200 periods lines. Potential retest resistance line at 285 sats. First test of 257 sats resistance.
Indicators: MACD bullish crossover above zero line. RSI above 50 points.
Volume slowly increased. Don't confirm bullish price action.
Pattern: Symetrical Triangle.
S/R strong support at 213 sats, support trend line at 230 sats. Major Resistance at 285 sats, Resistance 257.
Disclaimer: THIS IS NOT FINANCIAL ADVICE. All the information shared here is for learning and entertainment purposes only.

Aviso legal
As informações e publicações não se destinam a ser, e não constituem, conselhos ou recomendações financeiras, de investimento, comerciais ou de outro tipo fornecidos ou endossados pela TradingView. Leia mais nos Termos de Uso.
Aviso legal
As informações e publicações não se destinam a ser, e não constituem, conselhos ou recomendações financeiras, de investimento, comerciais ou de outro tipo fornecidos ou endossados pela TradingView. Leia mais nos Termos de Uso.