
The S&P Volatility Index is Set to Spike up to over $50
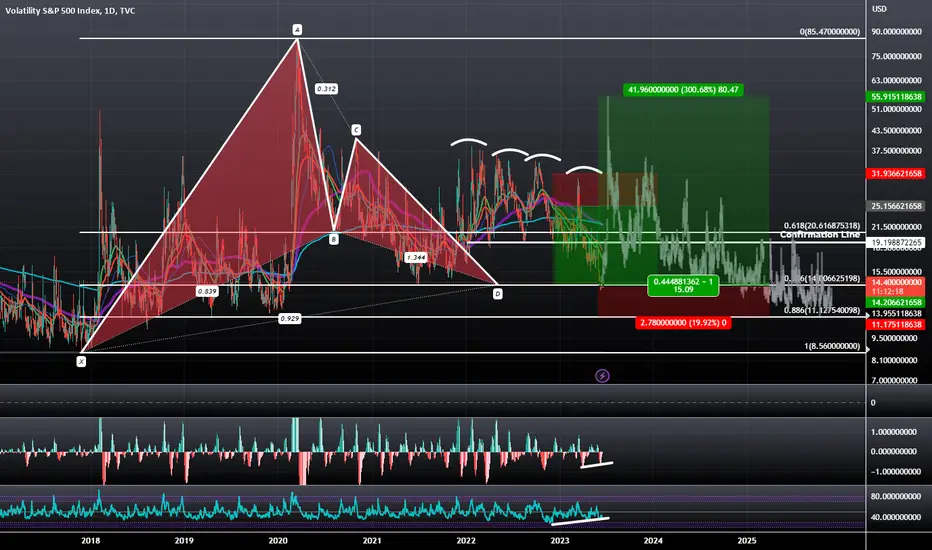
There is a Bullish Gartley visible on the Log Scale chart that is currently giving us a Potential Double Bottom at the 0.786 PCZ with Bullish Divergence on both the RSI and MACD and if it plays out, I think it could spike all the way up to around $55 before coming back down and continuing to the historical lows.
Trade ativo

Publicações relacionadas
Aviso legal
As informações e publicações não se destinam a ser, e não constituem, conselhos ou recomendações financeiras, de investimento, comerciais ou de outro tipo fornecidos ou endossados pela TradingView. Leia mais nos Termos de Uso.
Publicações relacionadas
Aviso legal
As informações e publicações não se destinam a ser, e não constituem, conselhos ou recomendações financeiras, de investimento, comerciais ou de outro tipo fornecidos ou endossados pela TradingView. Leia mais nos Termos de Uso.