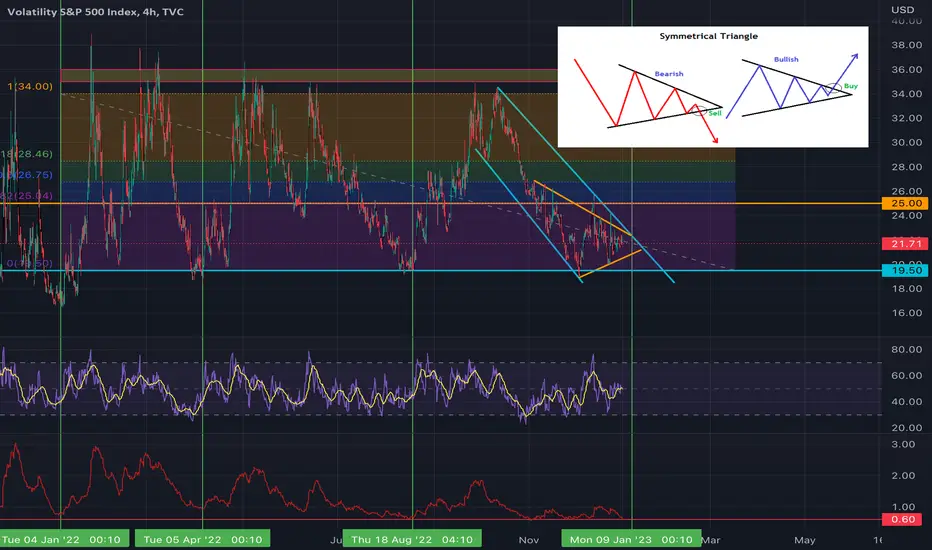
DESCRIPTION: The chart above is an analysis of the VIX and it current pattern formation of a SYMMETRICAL TRIANGLE FORMATION.
POINTS:
1. Strong Support for VIX at 19.50 with current Demand Pocket Ceiling for FIB is at 25.
2. Move should occur by the 9th of January as price action would have to compress a lot more by then.
3. Current overall trend is a down trend that we have been seeing for VIX since early October.
SCENARIO #1: If break of Symmetrical Triangle occurs towards the downside expect a bounce at 19.50.
SCENARIO #2: If break of Symmetrical Triangle occurs towards the upside expect resistance at 25.
*NOTE: NO RECESSION HAS EVER ENDED WITHOUT A VIX SPIKE TO 45 AT LEAST.
 VIX
VIX
POINTS:
1. Strong Support for VIX at 19.50 with current Demand Pocket Ceiling for FIB is at 25.
2. Move should occur by the 9th of January as price action would have to compress a lot more by then.
3. Current overall trend is a down trend that we have been seeing for VIX since early October.
SCENARIO #1: If break of Symmetrical Triangle occurs towards the downside expect a bounce at 19.50.
SCENARIO #2: If break of Symmetrical Triangle occurs towards the upside expect resistance at 25.
*NOTE: NO RECESSION HAS EVER ENDED WITHOUT A VIX SPIKE TO 45 AT LEAST.
VIX
Publicações relacionadas
Aviso legal
As informações e publicações não se destinam a ser, e não constituem, conselhos ou recomendações financeiras, de investimento, comerciais ou de outro tipo fornecidos ou endossados pela TradingView. Leia mais nos Termos de Uso.
Publicações relacionadas
Aviso legal
As informações e publicações não se destinam a ser, e não constituem, conselhos ou recomendações financeiras, de investimento, comerciais ou de outro tipo fornecidos ou endossados pela TradingView. Leia mais nos Termos de Uso.