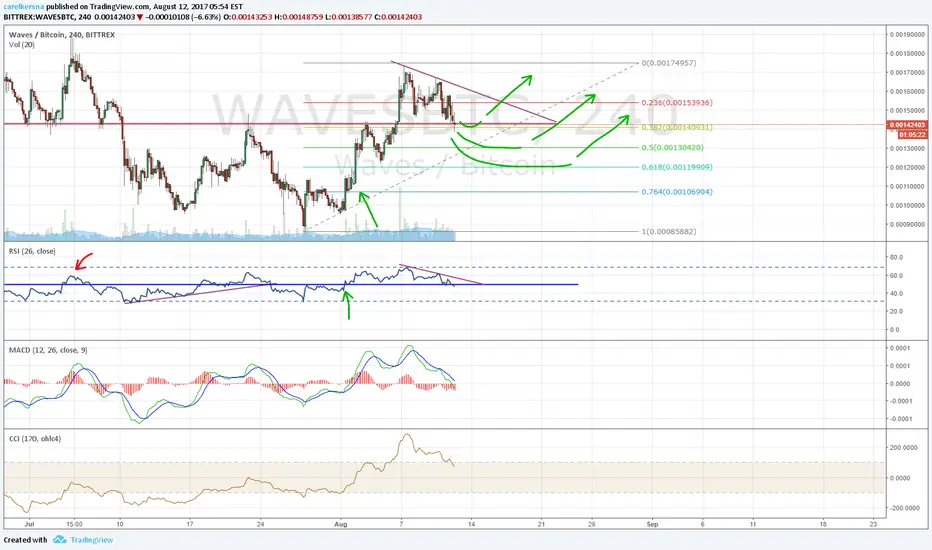
3 levels to watch.
Blue line also represents the 50 line on RSI. Expecting volatility around that level, because every time price makes a great move, RSI breaks below or above 50 level.
So as long as RSI stays above 50, its either movement to the upside or worst case sideways movement.
Blue line also represents the 50 line on RSI. Expecting volatility around that level, because every time price makes a great move, RSI breaks below or above 50 level.
So as long as RSI stays above 50, its either movement to the upside or worst case sideways movement.

Aviso legal
As informações e publicações não se destinam a ser, e não constituem, conselhos ou recomendações financeiras, de investimento, comerciais ou de outro tipo fornecidos ou endossados pela TradingView. Leia mais nos Termos de Uso.
Aviso legal
As informações e publicações não se destinam a ser, e não constituem, conselhos ou recomendações financeiras, de investimento, comerciais ou de outro tipo fornecidos ou endossados pela TradingView. Leia mais nos Termos de Uso.