
Dear My friends,
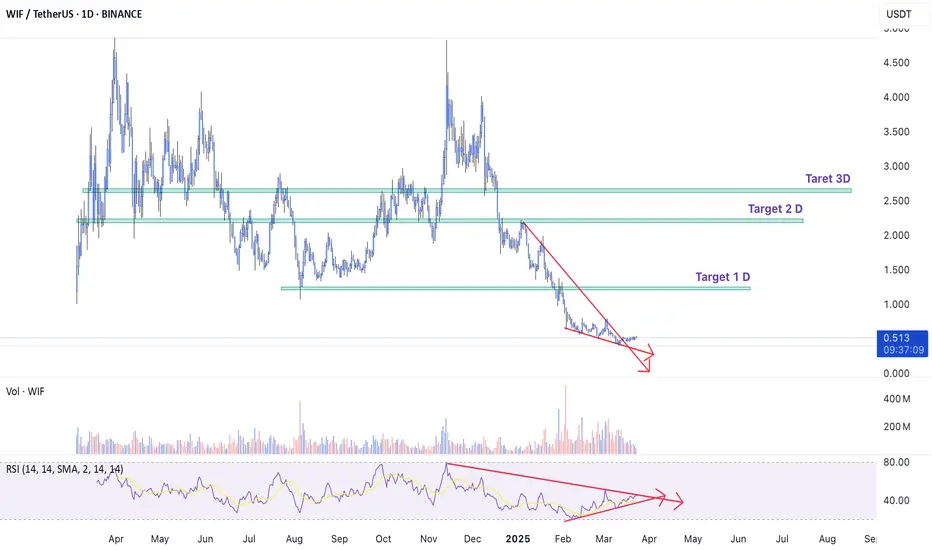
When looking at the WIF chart, I wonder, where is its bottom? The current price is even lower than when it was first listed on Binance. So, since I don’t know, I’ll just analyze it. And I’ll start from the bigger picture. When I zoom into the daily timeframe, everything seems clear to me. Take a look at the daily chart, and you’ll see that a divergence has appeared. The price is dropping, but the RSI indicator is rising. The price has broken out of the descending channel. Buying volume has been dominant in recent sessions. So, I’ve searched for target levels on the daily timeframe. I hope my analysis will help you, my friends.
Best Regards,
When looking at the WIF chart, I wonder, where is its bottom? The current price is even lower than when it was first listed on Binance. So, since I don’t know, I’ll just analyze it. And I’ll start from the bigger picture. When I zoom into the daily timeframe, everything seems clear to me. Take a look at the daily chart, and you’ll see that a divergence has appeared. The price is dropping, but the RSI indicator is rising. The price has broken out of the descending channel. Buying volume has been dominant in recent sessions. So, I’ve searched for target levels on the daily timeframe. I hope my analysis will help you, my friends.
Best Regards,

Publicações relacionadas
Aviso legal
As informações e publicações não se destinam a ser, e não constituem, conselhos ou recomendações financeiras, de investimento, comerciais ou de outro tipo fornecidos ou endossados pela TradingView. Leia mais nos Termos de Uso.
Publicações relacionadas
Aviso legal
As informações e publicações não se destinam a ser, e não constituem, conselhos ou recomendações financeiras, de investimento, comerciais ou de outro tipo fornecidos ou endossados pela TradingView. Leia mais nos Termos de Uso.