Long
WRX/BTC
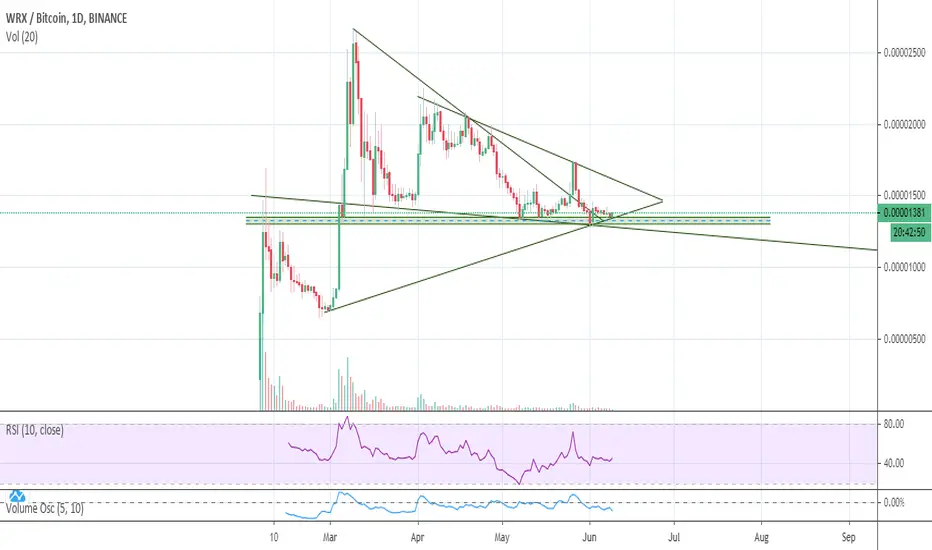
Not an expert. I'm simple, but simple works for me. Buy zone is highlighted just needs some volume to come in. RSI is showing a bullish divergence on the daily.
Break and close below 1270-ish and it's more downside. Break the diagonal trend line and it's more upside!
Break and close below 1270-ish and it's more downside. Break the diagonal trend line and it's more upside!
Nota
The diagonal support line that I have drawn is broken, but the horizontal support line is still holding. I'm not sure how this will play out, but I'd certainly be cautious here. If the horizontal line breaks, then there's a lot of space down below. A drop of 50% is certainly not out of the question.Diagonal trend lines are a bit tricky since you can always redraw them to fit your bias.
Trade fechado manualmente
See below for updated chart.
Aviso legal
As informações e publicações não se destinam a ser, e não constituem, conselhos ou recomendações financeiras, de investimento, comerciais ou de outro tipo fornecidos ou endossados pela TradingView. Leia mais nos Termos de Uso.
Aviso legal
As informações e publicações não se destinam a ser, e não constituem, conselhos ou recomendações financeiras, de investimento, comerciais ou de outro tipo fornecidos ou endossados pela TradingView. Leia mais nos Termos de Uso.