
WTI Poised for a Rally? Key Support Hold Could Send Prices Skywa
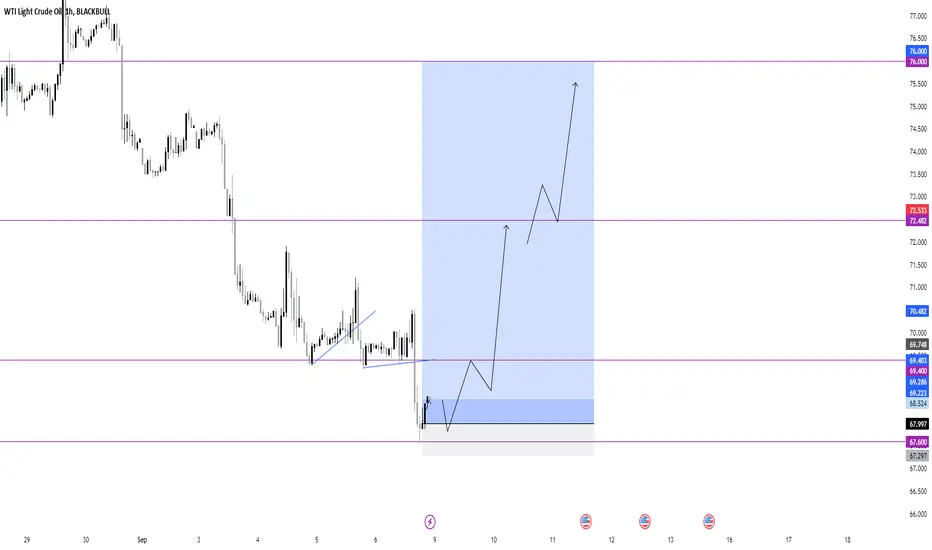
The chart indicates that WTI is approaching a critical support zone between $67.60 and $69.40, a level previously tested and held.
After forming a consolidation pattern, the price is likely to break upward, heading toward the next resistance at $72.50 and potentially extending to $76.00 if momentum builds.
A bullish move would be supported by the price remaining above the $69.40 area, indicating strong demand at these levels.
However, if this support breaks, there could be a further downward move towards $67.60.
The target zones to watch on the upside are $72.50 and $76.00, with significant resistance around those levels.
After forming a consolidation pattern, the price is likely to break upward, heading toward the next resistance at $72.50 and potentially extending to $76.00 if momentum builds.
A bullish move would be supported by the price remaining above the $69.40 area, indicating strong demand at these levels.
However, if this support breaks, there could be a further downward move towards $67.60.
The target zones to watch on the upside are $72.50 and $76.00, with significant resistance around those levels.

iSmashProfit
Publicações relacionadas
Aviso legal
As informações e publicações não se destinam a ser, e não constituem, conselhos ou recomendações financeiras, de investimento, comerciais ou de outro tipo fornecidos ou endossados pela TradingView. Leia mais nos Termos de Uso.
iSmashProfit
Publicações relacionadas
Aviso legal
As informações e publicações não se destinam a ser, e não constituem, conselhos ou recomendações financeiras, de investimento, comerciais ou de outro tipo fornecidos ou endossados pela TradingView. Leia mais nos Termos de Uso.