
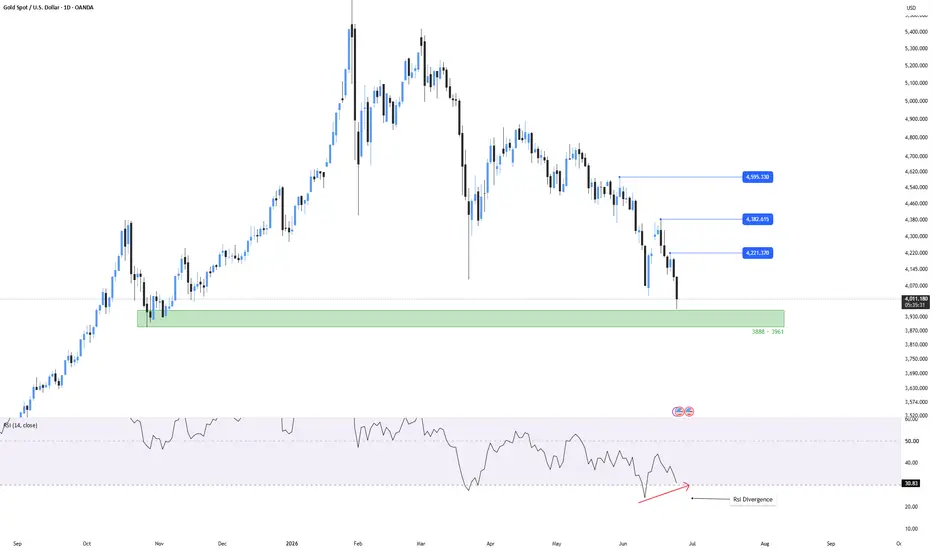
XAUUSD – Daily Support Meets RSI Divergence | Relief Rally Before Structural Decision?
Gold continues to trade inside a broader corrective phase after failing to sustain above its major highs. While the dominant higher-timeframe structure remains bearish, price is now approaching a significant daily demand zone that previously generated aggressive buying interest.
At the same time, momentum conditions are beginning to diverge from price action.
The most important development is not the recent decline itself, but the growing mismatch between price and RSI behavior on the daily timeframe.
Macro Context
Recent weakness in gold has largely been driven by:
The market has gradually shifted away from safe-haven demand and back toward interest-rate expectations.
However, despite these bearish macro drivers, downside momentum is beginning to weaken while price approaches a major higher-timeframe support region.
This creates the conditions for a corrective bullish phase even if the broader trend has not yet reversed.
Technical Structure
From a structural perspective, the market remains inside a sequence of lower highs and lower lows.
The primary trend is still bearish.
However, several factors suggest the current decline may be approaching exhaustion:
This creates a clear bullish RSI divergence on the daily timeframe.
A daily divergence alone is not a buy signal.
It is an early warning that bearish momentum is weakening and that the probability of a relief rally is increasing.
Liquidity & Order Flow Context
The recent decline appears to be a continuation move targeting downside liquidity rather than aggressive fresh bearish expansion.
Several observations support this view:
The key question is no longer whether support exists.
The key question is whether buyers can create displacement from support.
Without displacement, support remains only a zone—not confirmation.
RSI Divergence Analysis
The most interesting technical signal currently visible is the daily RSI divergence.
Price:
RSI:
This divergence suggests:
Historically, higher-timeframe divergences become significantly more reliable when they occur directly into major support zones.
That condition is currently developing.
Bullish Scenario – Relief Rally from Daily Support
This is currently the preferred tactical scenario.
Requirements:
Confirmation:
Potential upside objectives:
These levels represent logical liquidity and retracement objectives if buyers regain short-term control.
Bearish Continuation Scenario
Despite the divergence, the higher-timeframe trend remains bearish.
Requirements:
Confirmation:
In this case, the divergence would simply represent temporary momentum exhaustion rather than a structural bottom.
Strategic Framework
There are two approaches here:
The divergence itself is not the trade.
The trade is the structural confirmation that follows the divergence.
Conclusion
Primary Driver:
Price approaching a major daily demand zone while momentum weakens.
Secondary Driver:
Daily RSI bullish divergence signaling decreasing bearish efficiency.
Market Regime:
Late-stage bearish expansion transitioning toward a potential corrective recovery.
Tactical Stance:
The higher-timeframe trend remains bearish, but risk-reward is becoming increasingly favorable for a bullish reaction. The ideal confirmation would be a lower-timeframe MSS and bullish displacement after interaction with the 3888–3961 demand zone. Until that confirmation appears, the divergence should be treated as an alert for a potential reversal rather than proof of one.
Gold continues to trade inside a broader corrective phase after failing to sustain above its major highs. While the dominant higher-timeframe structure remains bearish, price is now approaching a significant daily demand zone that previously generated aggressive buying interest.
At the same time, momentum conditions are beginning to diverge from price action.
The most important development is not the recent decline itself, but the growing mismatch between price and RSI behavior on the daily timeframe.
Macro Context
Recent weakness in gold has largely been driven by:
- Higher real yields.
- Persistent USD strength.
- Reduced geopolitical premium.
- Fed policy remaining restrictive.
The market has gradually shifted away from safe-haven demand and back toward interest-rate expectations.
However, despite these bearish macro drivers, downside momentum is beginning to weaken while price approaches a major higher-timeframe support region.
This creates the conditions for a corrective bullish phase even if the broader trend has not yet reversed.
Technical Structure
From a structural perspective, the market remains inside a sequence of lower highs and lower lows.
The primary trend is still bearish.
However, several factors suggest the current decline may be approaching exhaustion:
- Price is nearing a major daily demand zone around 3888–3961.
- The current selloff is extending into historical support.
- RSI is producing a higher low while price is creating a lower low.
- Momentum deterioration is becoming visible despite continued downside pressure.
This creates a clear bullish RSI divergence on the daily timeframe.
A daily divergence alone is not a buy signal.
It is an early warning that bearish momentum is weakening and that the probability of a relief rally is increasing.
Liquidity & Order Flow Context
The recent decline appears to be a continuation move targeting downside liquidity rather than aggressive fresh bearish expansion.
Several observations support this view:
- Major sell-side liquidity has already been removed during the decline.
- Price is approaching an area where previous institutional demand entered the market.
- Momentum is no longer accelerating lower despite continued downside progression.
- The market is entering a location where trapped shorts may become vulnerable.
The key question is no longer whether support exists.
The key question is whether buyers can create displacement from support.
Without displacement, support remains only a zone—not confirmation.
RSI Divergence Analysis
The most interesting technical signal currently visible is the daily RSI divergence.
Price:
- Lower low.
RSI:
- Higher low.
This divergence suggests:
- Selling pressure is becoming less efficient.
- Momentum is no longer confirming new price lows.
- The probability of a corrective bullish expansion is increasing.
Historically, higher-timeframe divergences become significantly more reliable when they occur directly into major support zones.
That condition is currently developing.
Bullish Scenario – Relief Rally from Daily Support
This is currently the preferred tactical scenario.
Requirements:
- Price reaches or reacts from the 3888–3961 support zone.
- Daily divergence remains intact.
- Lower timeframes produce bullish MSS.
- Bullish displacement appears after liquidity is taken.
Confirmation:
- 4H bullish MSS.
- Strong impulsive reaction from support.
- Acceptance above local swing highs.
Potential upside objectives:
- 4221
- 4382
- 4595
These levels represent logical liquidity and retracement objectives if buyers regain short-term control.
Bearish Continuation Scenario
Despite the divergence, the higher-timeframe trend remains bearish.
Requirements:
- Daily support fails.
- Price accepts below the demand zone.
- No meaningful bullish displacement appears.
Confirmation:
- Daily closes below support.
- Failed reclaim attempts.
- Continuation of lower-high structure.
In this case, the divergence would simply represent temporary momentum exhaustion rather than a structural bottom.
Strategic Framework
There are two approaches here:
- Aggressive participants may wait for lower-timeframe MSS and bullish displacement once price reacts from support.
- Conservative participants may wait for direct interaction with the daily demand zone and then require confirmation before positioning.
The divergence itself is not the trade.
The trade is the structural confirmation that follows the divergence.
Conclusion
Primary Driver:
Price approaching a major daily demand zone while momentum weakens.
Secondary Driver:
Daily RSI bullish divergence signaling decreasing bearish efficiency.
Market Regime:
Late-stage bearish expansion transitioning toward a potential corrective recovery.
Tactical Stance:
The higher-timeframe trend remains bearish, but risk-reward is becoming increasingly favorable for a bullish reaction. The ideal confirmation would be a lower-timeframe MSS and bullish displacement after interaction with the 3888–3961 demand zone. Until that confirmation appears, the divergence should be treated as an alert for a potential reversal rather than proof of one.

For live market updates and high-probability setups, join my Telegram: t.me/G_Traders
Publicações relacionadas
Aviso legal
As informações e publicações não se destinam a ser, e não constituem, conselhos ou recomendações financeiras, de investimento, comerciais ou de outro tipo fornecidos ou endossados pela TradingView. Leia mais nos Termos de Uso.
For live market updates and high-probability setups, join my Telegram: t.me/G_Traders
Publicações relacionadas
Aviso legal
As informações e publicações não se destinam a ser, e não constituem, conselhos ou recomendações financeiras, de investimento, comerciais ou de outro tipo fornecidos ou endossados pela TradingView. Leia mais nos Termos de Uso.