
Fundamental Analysis
Gold remains under pressure as traders continue to watch USD strength, Treasury yields, and upcoming U.S. macro data.
For now, the structure still favours sellers while XAUUSD trades below the main EMA range. Any recovery should be treated as a technical pullback unless price can reclaim the EMA resistance zone with strong confirmation.
Technical Analysis
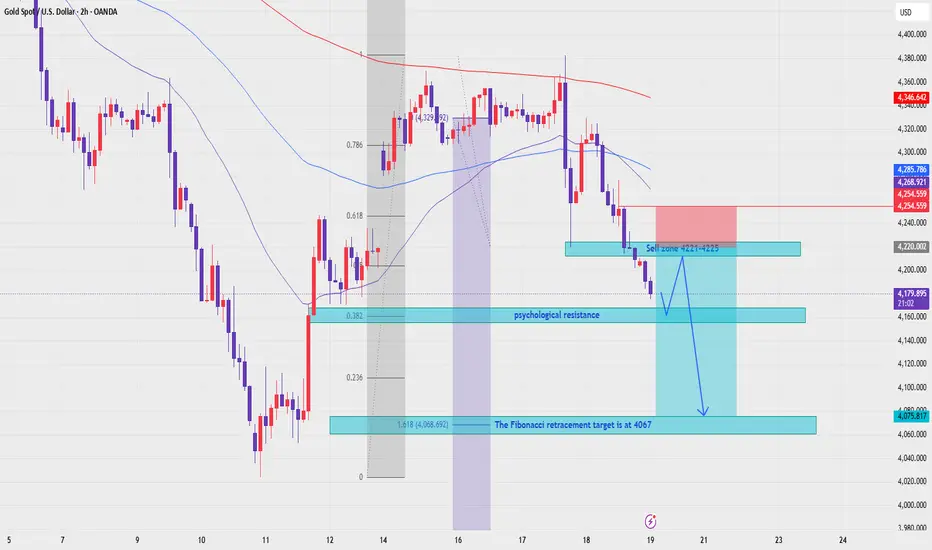
On the 2H chart, XAUUSD is trading below EMA 34, EMA 89, and EMA 200. This confirms that the current trend remains bearish, with the EMA structure acting as dynamic resistance above price.
Price has already rejected from the higher area and is now trading around 4,179. The current move shows strong bearish pressure, and the chart highlights a key sell zone around 4,221 - 4,225.
This sell zone is important because it aligns with the broken structure, previous reaction area, and EMA trend pressure. If gold pulls back into this zone and fails to break higher, sellers may regain control.
The psychological resistance zone around 4,160 - 4,170 is also important. If price stays below this area after a failed recovery, the bearish continuation scenario remains active.
The medium-term downside target is the Fibonacci level around 4,067, marked as the main retracement target on the chart.
Important Key Levels
Current price area: 4,179
Main sell zone: 4,221 - 4,225
EMA resistance area: 4,254 - 4,285
Psychological resistance: 4,160 - 4,170
Short-term bearish trigger: below 4,160
Fibonacci medium-term target: 4,067
Extended liquidity target: 4,075 - 4,067
Invalidation area: above 4,254
Trading Scenario
Main Sell Scenario
Entry: 4,221 - 4,225
Stop Loss: 4,254
Take Profit 1: 4,160
Take Profit 2: 4,075
Take Profit 3: 4,067
Sell Condition
The preferred setup is to wait for gold to pull back into the 4,221 - 4,225 sell zone. This area is the key resistance zone on the chart and aligns with the bearish EMA structure.
A sell setup becomes more valid if price forms bearish rejection from this zone, such as a long upper wick, bearish engulfing candle, failed breakout, or lower high below the EMA range.
If price rejects from 4,221 - 4,225 and breaks below 4,160, the bearish continuation view becomes stronger. The next target would be 4,075, followed by the Fibonacci medium-term target around 4,067.
Entry Conditions
Wait for price to retest 4,221 - 4,225.
Look for bearish rejection before entering sell.
A break below 4,160 confirms stronger downside pressure.
If price breaks and holds above 4,254, the sell setup is invalid.
Overall, the main view remains bearish while XAUUSD trades below EMA 34, EMA 89, and EMA 200. The preferred plan is to wait for a pullback into the 4,221 - 4,225 sell zone, then look for bearish confirmation toward 4,160, 4,075, and the Fibonacci target around 4,067.
Do you share the same bearish view on gold, or are you waiting for a cleaner pullback into the sell zone first?

📊 XAU Macro Pulse · XAUUSD · GBPUSD · EURUSD
Every setup earns its place on the chart.
🔔 Follow the structure. The rest is noise.
Personal analysis only t.me/+TxpetmVvKGhjZDhl
Every setup earns its place on the chart.
🔔 Follow the structure. The rest is noise.
Personal analysis only t.me/+TxpetmVvKGhjZDhl
Publicações relacionadas
Aviso legal
As informações e publicações não se destinam a ser, e não constituem, conselhos ou recomendações financeiras, de investimento, comerciais ou de outro tipo fornecidos ou endossados pela TradingView. Leia mais nos Termos de Uso.
📊 XAU Macro Pulse · XAUUSD · GBPUSD · EURUSD
Every setup earns its place on the chart.
🔔 Follow the structure. The rest is noise.
Personal analysis only t.me/+TxpetmVvKGhjZDhl
Every setup earns its place on the chart.
🔔 Follow the structure. The rest is noise.
Personal analysis only t.me/+TxpetmVvKGhjZDhl
Publicações relacionadas
Aviso legal
As informações e publicações não se destinam a ser, e não constituem, conselhos ou recomendações financeiras, de investimento, comerciais ou de outro tipo fornecidos ou endossados pela TradingView. Leia mais nos Termos de Uso.