
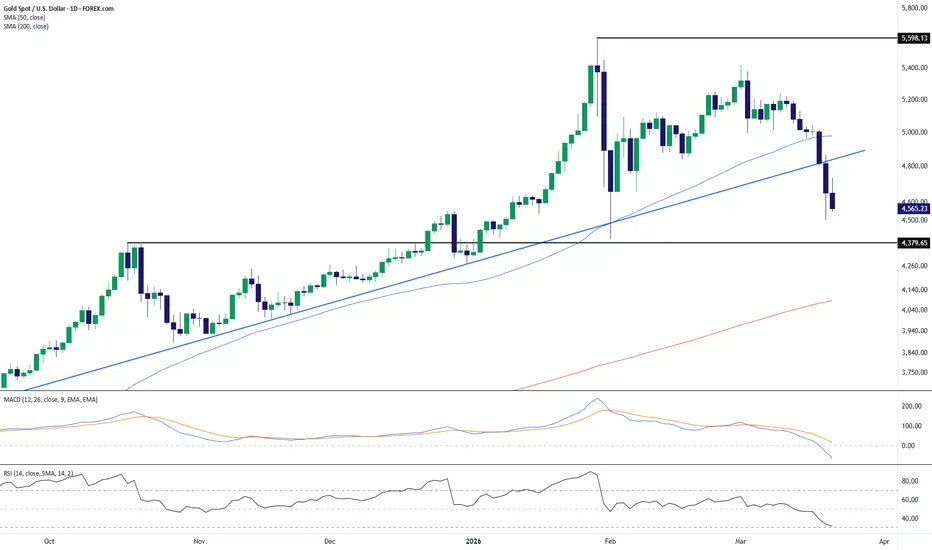
Gold Spot on the daily chart is showing a clear loss of momentum after failing to sustain the prior advance toward the upper resistance zone near 5,598. The chart had been respecting a rising trendline for several months, but recent price action has now broken below that support, shifting the short-term structure from constructive to defensive.
The moving averages add to that softer tone. Price has fallen beneath the 50-day SMA, which signals weakening medium-term momentum, while the 200-day SMA remains lower and still rising, keeping the broader trend technically intact for now. Even so, the break below the trendline and the 50-day average suggests the market is no longer in a clean bullish continuation phase.
Momentum indicators also support the deterioration. MACD has rolled over and moved deeper into bearish territory, reflecting increasing downside pressure. RSI has dropped toward the lower end of its range and is approaching oversold conditions, which confirms the recent weakness while also hinting that price is moving into an area where reactions can become more volatile.
A major technical level now sits around the horizontal support zone near 4,379, which has already acted as an important reference point on this chart. As long as price remains below the broken trendline and under the 50-day SMA, the near-term bias appears bearish. Whether the market stabilizes around the lower support band or continues to unwind will likely determine the next phase of structure.
Overall, gold is transitioning from trend continuation into correction territory, with broken trend support, weakening momentum, and a key horizontal support zone now taking center stage.
-MW
The moving averages add to that softer tone. Price has fallen beneath the 50-day SMA, which signals weakening medium-term momentum, while the 200-day SMA remains lower and still rising, keeping the broader trend technically intact for now. Even so, the break below the trendline and the 50-day average suggests the market is no longer in a clean bullish continuation phase.
Momentum indicators also support the deterioration. MACD has rolled over and moved deeper into bearish territory, reflecting increasing downside pressure. RSI has dropped toward the lower end of its range and is approaching oversold conditions, which confirms the recent weakness while also hinting that price is moving into an area where reactions can become more volatile.
A major technical level now sits around the horizontal support zone near 4,379, which has already acted as an important reference point on this chart. As long as price remains below the broken trendline and under the 50-day SMA, the near-term bias appears bearish. Whether the market stabilizes around the lower support band or continues to unwind will likely determine the next phase of structure.
Overall, gold is transitioning from trend continuation into correction territory, with broken trend support, weakening momentum, and a key horizontal support zone now taking center stage.
-MW

Aviso legal
As informações e publicações não se destinam a ser, e não constituem, conselhos ou recomendações financeiras, de investimento, comerciais ou de outro tipo fornecidos ou endossados pela TradingView. Leia mais nos Termos de Uso.
Aviso legal
As informações e publicações não se destinam a ser, e não constituem, conselhos ou recomendações financeiras, de investimento, comerciais ou de outro tipo fornecidos ou endossados pela TradingView. Leia mais nos Termos de Uso.