
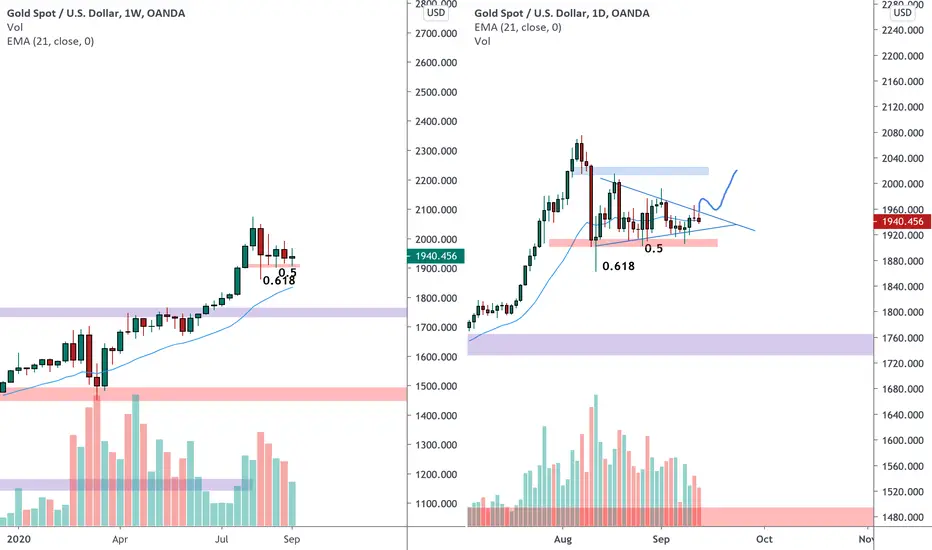
Gold has reached in the last weeks a key level of 2072 and retraced back below the 2000 level.
On the weekly chart (left) we can see that market found support on a weekly structure and price retrace till the 0.618 fib level and went back up at the 0.5.
On the daily chart (right) the market testing the discending trendline and creating a triangle pattern.
We can expect the price to break above the discending trendline and the upper daily structure to test the recent highs.
–––––
Follow the Shrimp 🦐
Here is the Plancton0618 technical analysis , please comment below if you have any question.
The ENTRY in the market will be taken only if the condition of Plancton0618 strategy will trigger.
On the weekly chart (left) we can see that market found support on a weekly structure and price retrace till the 0.618 fib level and went back up at the 0.5.
On the daily chart (right) the market testing the discending trendline and creating a triangle pattern.
We can expect the price to break above the discending trendline and the upper daily structure to test the recent highs.
–––––
Follow the Shrimp 🦐
Here is the Plancton0618 technical analysis , please comment below if you have any question.
The ENTRY in the market will be taken only if the condition of Plancton0618 strategy will trigger.

Aviso legal
As informações e publicações não se destinam a ser, e não constituem, conselhos ou recomendações financeiras, de investimento, comerciais ou de outro tipo fornecidos ou endossados pela TradingView. Leia mais nos Termos de Uso.
Aviso legal
As informações e publicações não se destinam a ser, e não constituem, conselhos ou recomendações financeiras, de investimento, comerciais ou de outro tipo fornecidos ou endossados pela TradingView. Leia mais nos Termos de Uso.