
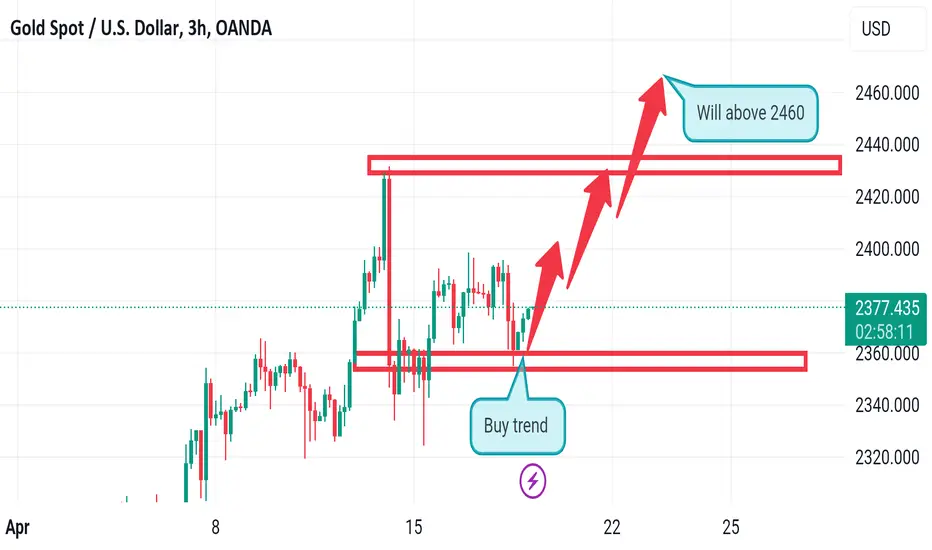
XAU/USD trades near $2,371 and the daily chart shows that the slide may continue. Technical indicators retreat from extreme overbought levels, suggesting the decline may continue. Still, a steeper slide remains out of the picture, as XAU/USD refuses to give up while developing its moving averages above all Simple Moving Average (SMA) maintains its firmly bullish slope at around $2,280 and roughly $300 above an also bullish 100 SMA
Nota
Gold running 150 pips profitNota
200+ pips running gold
Aviso legal
As informações e publicações não se destinam a ser, e não constituem, conselhos ou recomendações financeiras, de investimento, comerciais ou de outro tipo fornecidos ou endossados pela TradingView. Leia mais nos Termos de Uso.
Aviso legal
As informações e publicações não se destinam a ser, e não constituem, conselhos ou recomendações financeiras, de investimento, comerciais ou de outro tipo fornecidos ou endossados pela TradingView. Leia mais nos Termos de Uso.