
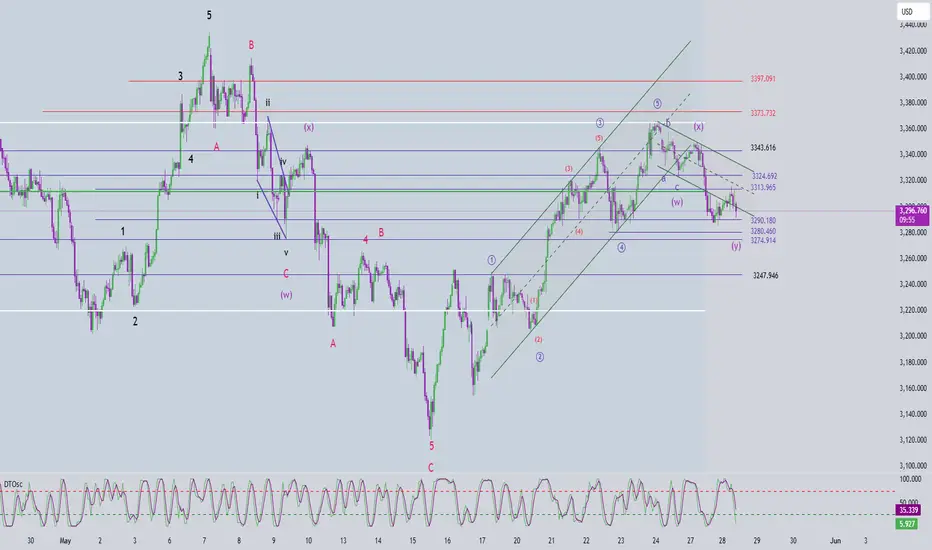
🔍 Current Wave Structure
Following yesterday’s sharp decline, price has made a mild recovery and is currently consolidating around the 3314 area. The drop has nearly reached the projected wave C (green) target, but the current rebound — with overlapping small H1 candles — suggests the bullish structure is still unconvincing.
We’re now monitoring two potential scenarios:
✅ Scenario 1 – Correction Completed
Wave C appears to be complete, and the market may be entering a new bullish trend.
However, the overlapping candles on H1 hint that this could be a leading diagonal (wave 1).
In this case, a deeper pullback (wave 2) is expected — likely forming a zigzag or flat correction.
📌 Strategy:
Wait for wave 2 to complete before looking for a better Buy entry.
🌀 Scenario 2 – Ongoing Correction
If price continues to move sideways, we may be in wave b of a double zigzag correction (wave Y).
🎯 Wave c target within wave Y: 3324
If price breaks below 3284 before reaching 3324, wave c may have already started and could complete around 3280–3274.
📈 Momentum Outlook
• Daily (D1): Momentum remains bearish → primary trend still leans downward
• H4: Bullish momentum → short-term recovery possible today
• H1: Near oversold → watch for bullish reversal signals in current zone for intraday Buy setups
🎯 Trade Plan
⏰ Intraday Buy (Scalp):
• Entry: 3292 – 3289
• SL: 3282
• TP1: 3313
• TP2: 3324
🕰️ Ideal timing: During the London session to end of New York session
🎯 Swing Buy Setup:
• Entry: 3280 – 3277
• SL: 3270
• TP1: 3290
• TP2: 3313
• TP3: 3324
🕰️ Ideal timing: European to late US session
🎯 Sell Zone: 3324 – 3327
• SL: 3334
• TP1: 3313
• TP2: 3290
• TP3: 3280
🕰️ Best considered if price reaches resistance during US session or late EU session
📌 All scenarios will be updated once wave 2 is confirmed or price decisively breaks below 3284.
Be patient — let the market give you clear signals before taking action.
Trade ativo
🕵️♂️ H4 Chart Observation – XAUUSDOn the H4 timeframe, we’re seeing bullish candles with short bodies, indicating a lack of strong momentum behind the move.
📈 H4 momentum is approaching overbought territory —
If the current candle closes and the next one follows through, we could start seeing signs of a potential bearish reversal.
🔍 Our plan:
Keep monitoring H4 momentum. Once it enters the overbought zone, we’ll shift to the H1 timeframe to look for Sell setups with confirmation.
Trade fechado: objetivo atingido
170 pips Entry Sell: 3324 – 3327Nota
270 pips Entry Sell: 3324 – 3327 Full TP2
📢 Sometimes signals appear on TradingView with a slight delay!
🚀 Join our Telegram channel to get instant updates and real-time scalping signals:
👉 t.me/+lASNLyXKqcFiYmJl
🚀 Join our Telegram channel to get instant updates and real-time scalping signals:
👉 t.me/+lASNLyXKqcFiYmJl
Aviso legal
As informações e publicações não se destinam a ser, e não constituem, conselhos ou recomendações financeiras, de investimento, comerciais ou de outro tipo fornecidos ou endossados pela TradingView. Leia mais nos Termos de Uso.
📢 Sometimes signals appear on TradingView with a slight delay!
🚀 Join our Telegram channel to get instant updates and real-time scalping signals:
👉 t.me/+lASNLyXKqcFiYmJl
🚀 Join our Telegram channel to get instant updates and real-time scalping signals:
👉 t.me/+lASNLyXKqcFiYmJl
Aviso legal
As informações e publicações não se destinam a ser, e não constituem, conselhos ou recomendações financeiras, de investimento, comerciais ou de outro tipo fornecidos ou endossados pela TradingView. Leia mais nos Termos de Uso.