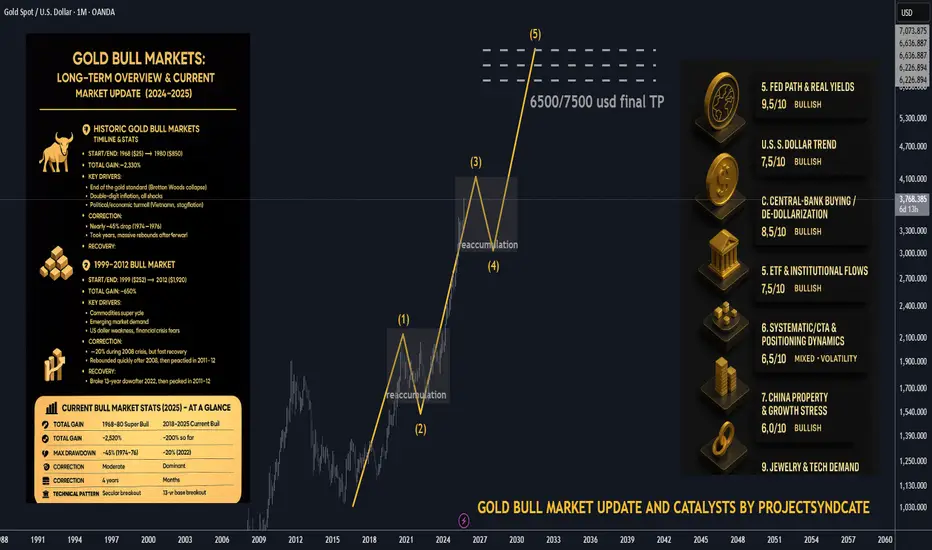
Gold Bull Markets Long Term Overview and 2025 Market Update
________________________________________
• This cycle is different: record central-bank buying + renewed ETF inflows + lower real rates = powerful tailwind.
• Price: Gold notched fresh ATHs this month (up to $3,790.82). 2025 is shaping up as the strongest year since the late 1970s.
• Relative: Gold is crushing equities YTD (≈+40% vs S&P 500 ≈+13% total return).
• Setup: A 13-year “cup-and-handle” breakout in 2024 kick-started the move.
• Outlook: Base case from the Street: $3,700 by end-’25 and ~$4,000 by mid-’26; upside to $4,500 if flows accelerate.
________________________________________
🏆 Historic Gold Bull Markets — Timeline & Stats
1) 1968–1980 “Super Bull”
• Start/End: ~$35 → $850 (Jan 1980)
• Gain: ~2,330%
• Drivers: End of Bretton Woods, oil shocks, double-digit inflation, geopolitical stress.
• Drawdown: ~–45% (1974–1976) before the final blow-off run.
2) 1999–2011/12
• Start/Peak: ~$252 (1999) → ~$1,920 (2011–12)
• Gain: ~650%
• Drivers: Commodities supercycle, EM demand, USD weakness, GFC safe-haven bid.
3) 2016/2018–Present (The “CB-Led” Cycle)
• Start Zone: $1,050–$1,200 → New ATH $3,790 (Sep 2025)
• Gain: ~215–260% (depending on 2016 vs 2018 anchor)
• Drivers: Record central-bank accumulation, sticky inflation/low real rates, geopolitics; 2024 13-yr base breakout.
________________________________________
📊 At-A-Glance Comparison (Updated 2025)
Metric 1968–80 Super Bull 1999–2012 2016/18–2025 Current
🚀 Total Gain ~2,330% ~650% ~215–260% (so far)
⏲️ Duration 12 yrs 13 yrs 7–9 yrs (ongoing)
💔 Max Drawdown ~–45% (’74–’76) ~–30% (’08) ~–20% (2022)
🏦 Main Buyer Retail/Europe Funds/EM Central Banks (dominant)
🏛️ Pattern Secular parabolic Cyclical ramps 13-yr base → breakout (’24)
Notes: current cycle characteristics validated by WGC demand trends & technical breakout in Mar 2024.
________________________________________
📈 Top 10 Stats of the Current Bull (2025)
1. Price & ATHs: Spot $3,75–$3,79k; fresh ATH $3,790.82 on Sep 23, 2025.
2. 2025 YTD: Roughly +40–43% YTD (best since the late ’70s).
3. Central Banks: 1,045 t added in 2024 (3rd straight 1k+ year). H1’25 ≈ 415 t (still elevated).
4. ETF Flows: Strongest half-year inflows since 2020, aiding the surge.
5. Gold vs Equities: Gold ≈+40% vs S&P 500 ≈+13% total return YTD.
6. Jewelry Demand: Price strength is crimping tonnage (2024 down ~11%; Q2’25 –14% y/y), even as value hits records.
7. Gold–Silver Ratio: Now around ~85–88 (silver catching up as it pushes $43–$44).
8. Macro Link: Strong safe-haven bid + rate-cut hopes supporting new highs.
9. Technical: Confirmed cup-and-handle breakout (Mar ’24) underpinning trend.
10. Street Forecasts: DB lifts 2026 to $4,000; GS baseline $4,000 by mid-’26, upside $4,500 with bigger private-investor rotation.
________________________________________
🔄 What Makes This Bull Different (2025 Edition)
• 🏦 Central-Bank Dominance — Official sector is the anchor buyer (3rd straight 1k+ tonne year in 2024; 2025 tracking strong despite Q2 deceleration).
• ⚡ Faster Recoveries — Pullbacks have been shallower and shorter vs the 1970s analog.
• 📈 Coexisting With Risk Assets — Rare combo: gold ATHs with equities up YTD suggests a macro hedge bid alongside optimism in select risk assets.
• 📐 Structural Breakout — The 13-year base cleared in 2024 set multi-year targets.
________________________________________
🎯 Strategy Ideas (2025 & Beyond)
Core
• Buy/Hold on Dips: Stagger entries (DCA) into physical (allocated), ETFs (e.g., GLD/IAU), and quality miners/royalties.
• Prefer Physical/Allocated where counterparty risk matters; use ETFs for liquidity.
Satellite/Leverage
• Silver & GSR Mean-Reversion: With the GSR ~85–88, silver historically offers torque in up-legs. Pair with high-quality silver miners.
• Factor Tilt in Miners: Focus on low AISC, strong balance sheets, growing reserves, and jurisdictions with rule-of-law.
Risk-Management
• Define max drawdown tolerance per sleeve; pre-plan trims near parabolic extensions or if macro invalidates (e.g., real-yield spike).
________________________________________
🧪 Reality Check: What Could Invalidate the Bull?
• Real yields + USD rip higher (sustained), dampening non-yielding assets.
• Sharp halt in official-sector buying (e.g., policy shifts).
• Rapid growth re-acceleration reducing safe-haven & rate-cut expectations.
________________________________________
🧭 Quick Reference Tables
🧾 Summary: Historic vs Current
Feature 1968–80 1999–2012 2016/18–2025
Total Gain ~2,330% ~650% ~215–260%
Duration 12 yrs 13 yrs 7–9 yrs (ongoing)
Correction ~–45% ~–30% ~–20% (’22)
Main Buyer Retail/Europe Funds/EM Central Banks
Pattern Parabolic Cyclical Cup & Handle → Secular
🧩 “If-This-Then-That” Playbook
• If real yields fall & CB buying persists → Ride trend / add on consolidations.
• If USD + real yields jump → Trim beta, keep core hedge.
• If GSR stays >80 with silver momentum → Overweight silver sleeve for torque.
________________________________________
🧠 Outside-the-Box Adds
💼 Role in a Portfolio (example frameworks)
• Resilience sleeve (5–10%): Physical + broad ETF.
• Offense sleeve (2–5%): Quality miners/royalties; optional silver tilt.
• Tactical (0–3%): Trend-following overlay (breakouts/consolidations).
🧭 Decision Checkpoints (quarterly)
• Central-bank net purchases (WGC).
• ETF flows (Western markets).
• Real yields (10y TIPS), USD trend, and GSR.
________________________________________
🔚 Key Takeaways (Updated)
• Relentless official-sector demand + technical breakout are the twin pillars of this cycle.
• Macro mix (policy easing expectations, geopolitics, diversification from USD reserves) supports an extended run.
• Base case: Street sees $3.7k by end-’25 and ~$4k by mid-’26, with upside to $4.5k if private capital rotation accelerates. Manage risk; embrace volatility.
________________________________________
• This cycle is different: record central-bank buying + renewed ETF inflows + lower real rates = powerful tailwind.
• Price: Gold notched fresh ATHs this month (up to $3,790.82). 2025 is shaping up as the strongest year since the late 1970s.
• Relative: Gold is crushing equities YTD (≈+40% vs S&P 500 ≈+13% total return).
• Setup: A 13-year “cup-and-handle” breakout in 2024 kick-started the move.
• Outlook: Base case from the Street: $3,700 by end-’25 and ~$4,000 by mid-’26; upside to $4,500 if flows accelerate.
________________________________________
🏆 Historic Gold Bull Markets — Timeline & Stats
1) 1968–1980 “Super Bull”
• Start/End: ~$35 → $850 (Jan 1980)
• Gain: ~2,330%
• Drivers: End of Bretton Woods, oil shocks, double-digit inflation, geopolitical stress.
• Drawdown: ~–45% (1974–1976) before the final blow-off run.
2) 1999–2011/12
• Start/Peak: ~$252 (1999) → ~$1,920 (2011–12)
• Gain: ~650%
• Drivers: Commodities supercycle, EM demand, USD weakness, GFC safe-haven bid.
3) 2016/2018–Present (The “CB-Led” Cycle)
• Start Zone: $1,050–$1,200 → New ATH $3,790 (Sep 2025)
• Gain: ~215–260% (depending on 2016 vs 2018 anchor)
• Drivers: Record central-bank accumulation, sticky inflation/low real rates, geopolitics; 2024 13-yr base breakout.
________________________________________
📊 At-A-Glance Comparison (Updated 2025)
Metric 1968–80 Super Bull 1999–2012 2016/18–2025 Current
🚀 Total Gain ~2,330% ~650% ~215–260% (so far)
⏲️ Duration 12 yrs 13 yrs 7–9 yrs (ongoing)
💔 Max Drawdown ~–45% (’74–’76) ~–30% (’08) ~–20% (2022)
🏦 Main Buyer Retail/Europe Funds/EM Central Banks (dominant)
🏛️ Pattern Secular parabolic Cyclical ramps 13-yr base → breakout (’24)
Notes: current cycle characteristics validated by WGC demand trends & technical breakout in Mar 2024.
________________________________________
📈 Top 10 Stats of the Current Bull (2025)
1. Price & ATHs: Spot $3,75–$3,79k; fresh ATH $3,790.82 on Sep 23, 2025.
2. 2025 YTD: Roughly +40–43% YTD (best since the late ’70s).
3. Central Banks: 1,045 t added in 2024 (3rd straight 1k+ year). H1’25 ≈ 415 t (still elevated).
4. ETF Flows: Strongest half-year inflows since 2020, aiding the surge.
5. Gold vs Equities: Gold ≈+40% vs S&P 500 ≈+13% total return YTD.
6. Jewelry Demand: Price strength is crimping tonnage (2024 down ~11%; Q2’25 –14% y/y), even as value hits records.
7. Gold–Silver Ratio: Now around ~85–88 (silver catching up as it pushes $43–$44).
8. Macro Link: Strong safe-haven bid + rate-cut hopes supporting new highs.
9. Technical: Confirmed cup-and-handle breakout (Mar ’24) underpinning trend.
10. Street Forecasts: DB lifts 2026 to $4,000; GS baseline $4,000 by mid-’26, upside $4,500 with bigger private-investor rotation.
________________________________________
🔄 What Makes This Bull Different (2025 Edition)
• 🏦 Central-Bank Dominance — Official sector is the anchor buyer (3rd straight 1k+ tonne year in 2024; 2025 tracking strong despite Q2 deceleration).
• ⚡ Faster Recoveries — Pullbacks have been shallower and shorter vs the 1970s analog.
• 📈 Coexisting With Risk Assets — Rare combo: gold ATHs with equities up YTD suggests a macro hedge bid alongside optimism in select risk assets.
• 📐 Structural Breakout — The 13-year base cleared in 2024 set multi-year targets.
________________________________________
🎯 Strategy Ideas (2025 & Beyond)
Core
• Buy/Hold on Dips: Stagger entries (DCA) into physical (allocated), ETFs (e.g., GLD/IAU), and quality miners/royalties.
• Prefer Physical/Allocated where counterparty risk matters; use ETFs for liquidity.
Satellite/Leverage
• Silver & GSR Mean-Reversion: With the GSR ~85–88, silver historically offers torque in up-legs. Pair with high-quality silver miners.
• Factor Tilt in Miners: Focus on low AISC, strong balance sheets, growing reserves, and jurisdictions with rule-of-law.
Risk-Management
• Define max drawdown tolerance per sleeve; pre-plan trims near parabolic extensions or if macro invalidates (e.g., real-yield spike).
________________________________________
🧪 Reality Check: What Could Invalidate the Bull?
• Real yields + USD rip higher (sustained), dampening non-yielding assets.
• Sharp halt in official-sector buying (e.g., policy shifts).
• Rapid growth re-acceleration reducing safe-haven & rate-cut expectations.
________________________________________
🧭 Quick Reference Tables
🧾 Summary: Historic vs Current
Feature 1968–80 1999–2012 2016/18–2025
Total Gain ~2,330% ~650% ~215–260%
Duration 12 yrs 13 yrs 7–9 yrs (ongoing)
Correction ~–45% ~–30% ~–20% (’22)
Main Buyer Retail/Europe Funds/EM Central Banks
Pattern Parabolic Cyclical Cup & Handle → Secular
🧩 “If-This-Then-That” Playbook
• If real yields fall & CB buying persists → Ride trend / add on consolidations.
• If USD + real yields jump → Trim beta, keep core hedge.
• If GSR stays >80 with silver momentum → Overweight silver sleeve for torque.
________________________________________
🧠 Outside-the-Box Adds
💼 Role in a Portfolio (example frameworks)
• Resilience sleeve (5–10%): Physical + broad ETF.
• Offense sleeve (2–5%): Quality miners/royalties; optional silver tilt.
• Tactical (0–3%): Trend-following overlay (breakouts/consolidations).
🧭 Decision Checkpoints (quarterly)
• Central-bank net purchases (WGC).
• ETF flows (Western markets).
• Real yields (10y TIPS), USD trend, and GSR.
________________________________________
🔚 Key Takeaways (Updated)
• Relentless official-sector demand + technical breakout are the twin pillars of this cycle.
• Macro mix (policy easing expectations, geopolitics, diversification from USD reserves) supports an extended run.
• Base case: Street sees $3.7k by end-’25 and ~$4k by mid-’26, with upside to $4.5k if private capital rotation accelerates. Manage risk; embrace volatility.
Nota
🎁Please hit the like button and🎁Leave a comment to support our team!
Nota
GAMMA SQUEEZE: Why Gold Prices will hit 5 000 + USD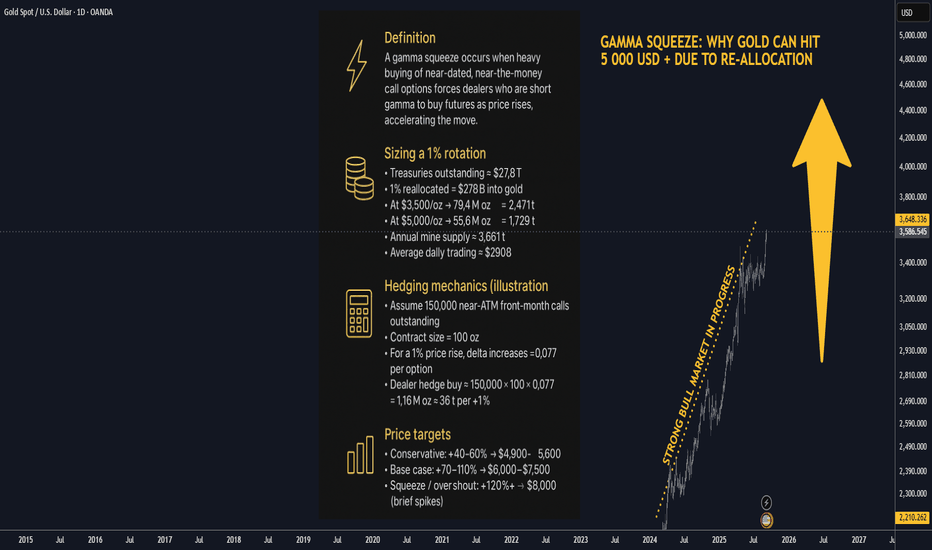
Nota
1000 USD: Coffee Bull Market Overview: Prices set to DOUBLE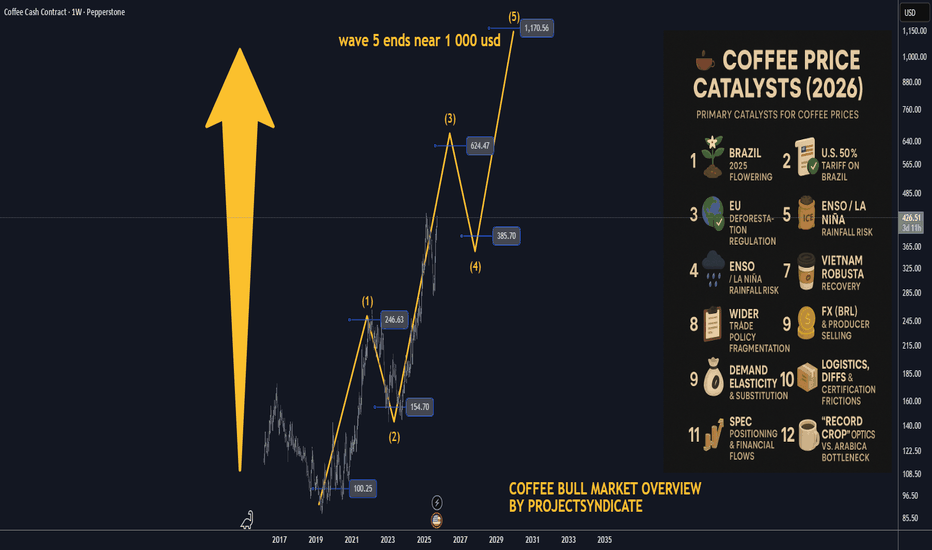
Nota
Blueprint to Becoming a Successful Gold Trader in 2025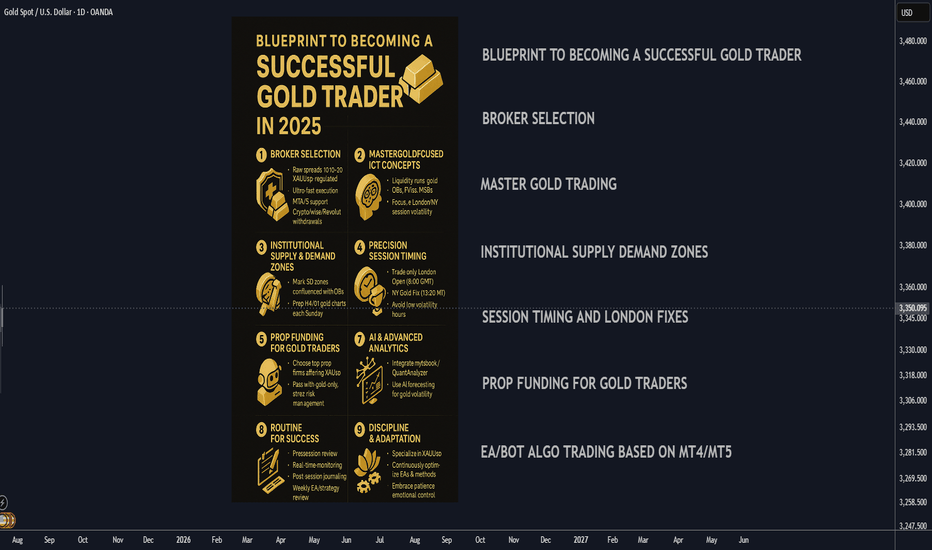
Nota
Intraday Gold Trading System with Neural Networks: Step-by-Step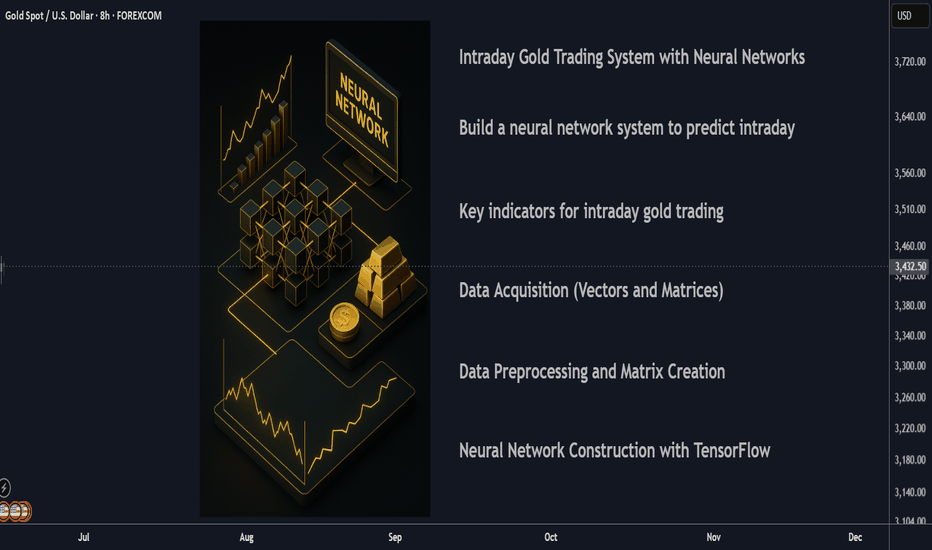
Nota
Platinum 10 years accumulation 2 000 USD Overview of Catalysts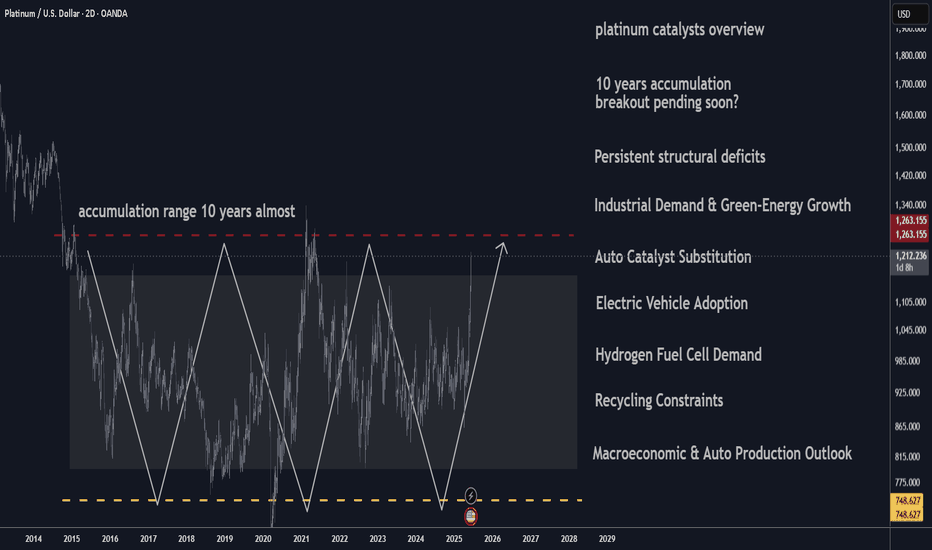
Nota
GOLD Bull Market Price Target is 7 500 USD accumulate on dips
Nota
September 2025 Market Summary Gold and Forex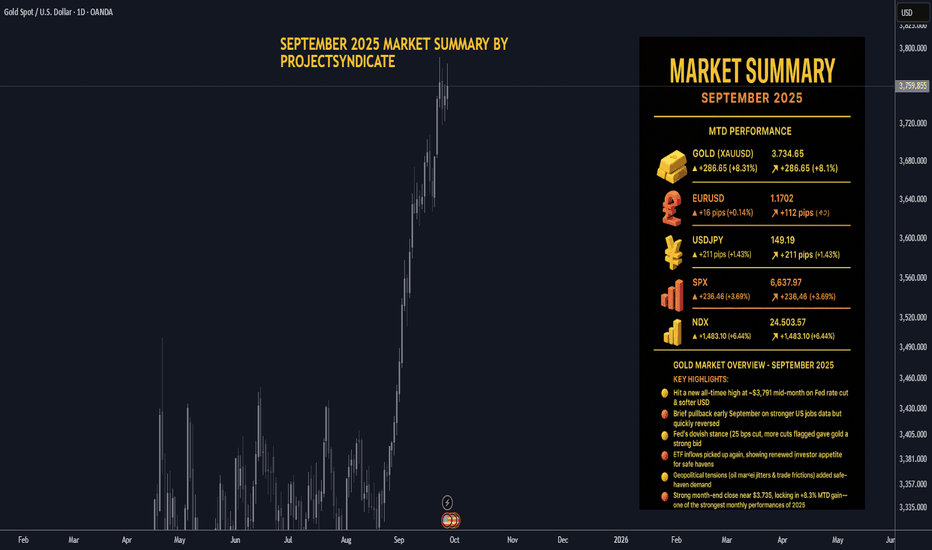
Nota
Gold next week: Key S/R Levels and Outlook for Traders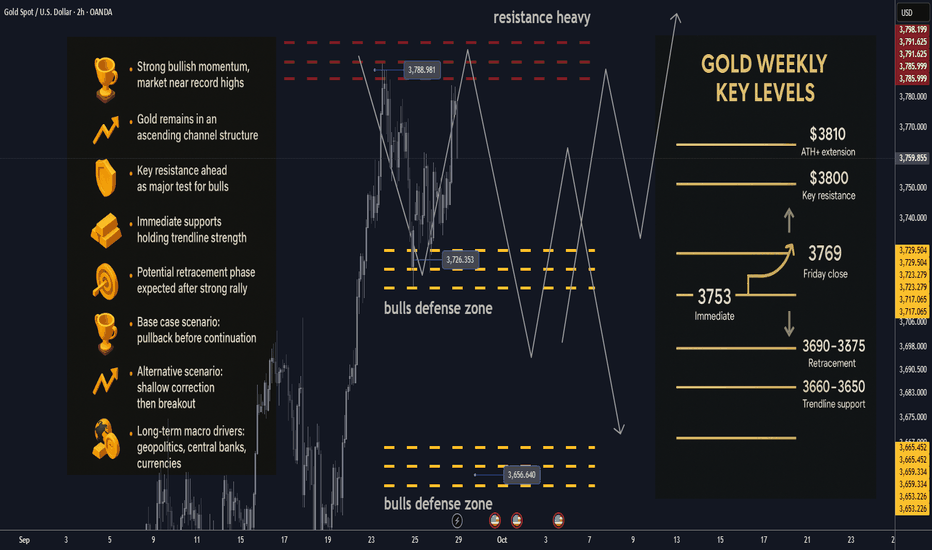
Nota
US govt Shutdown Impact on GOLD/BTC/SPX/NDX Overview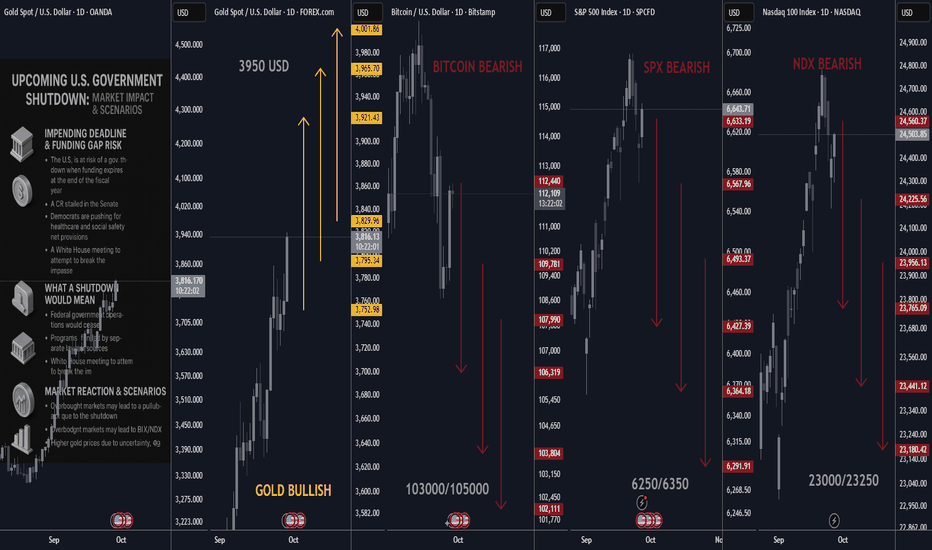
Nota
Silver Market Once in a Lifetime Breakout: 120/140 USD PT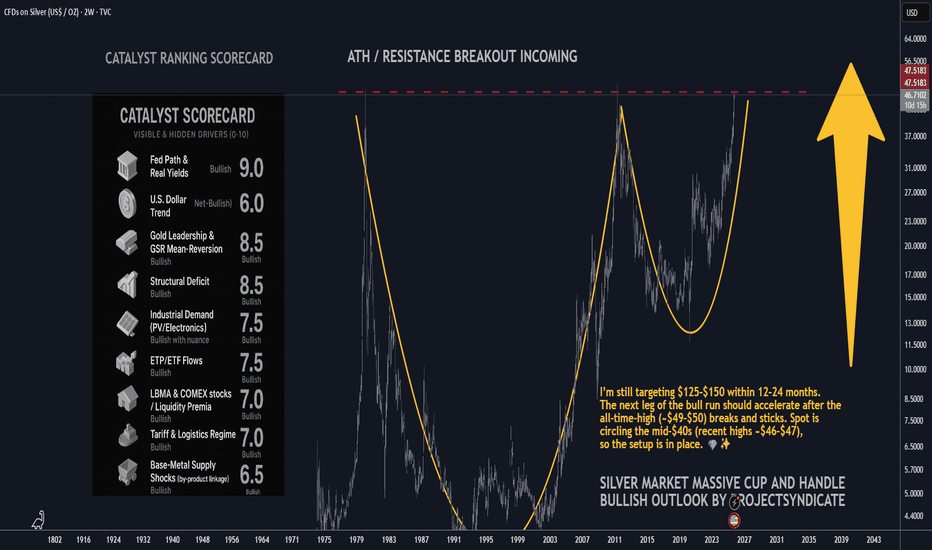
Nota
silver getting close to breaking the decades long ATHwatch out once ATH is broken it's blue sky for silver bulls
Nota
After a meeting with congressional leaders and President Donald Trump at the White House Monday afternoon to try to avoid a government shutdown, Vice President JD Vance said, "I think we're headed to a shutdown".Nota
ProjectSyndicate Market Summary | Weekly update📊 WTD performance
🟡 GOLD (XAUUSD): ~3,882.00 | +148.00 (+3.97 %)
💶 EURUSD: ~1.1742 | +42 pips (+0.36 %)
💷 GBPUSD: ~1.3449 | +50 pips (+0.37 %)
💴 USDJPY: ~147.47 | −138 pips (−0.93 %)
📈 SPX: ~6,715.79 | +77.84 (+1.17 %)
📈 NDX: ~24,800.73 | +297.60 (+1.21 %)
🗞 Highlights This Week (Gold & FX)
🇺🇸 Dovish Fed expectations re-ignited on weak private payrolls, fueling gold and pressuring USD
🟡 Gold pierced $3,890 intraday and held above $3,850 amid safe-haven demand
💶 EUR/USD rallied on USD softness; GBP/USD held gains amid mixed UK data
💴 JPY strengthened as USD weakness and risk aversion boosted Yen demand
📈 U.S. equities gained modestly as rate cut hopes kept sentiment supported
🟡 Gold Market Note – This Week
Gold extended its rally, reclaiming fresh highs near $3,890/oz as expectations for multiple Fed cuts gained traction.
Support zones now cluster near $3,800, while resistance lies above $3,900. The metal remains on track for a strong weekly close.
Nota
Gold next week: Key S/R Levels and Outlook for Traders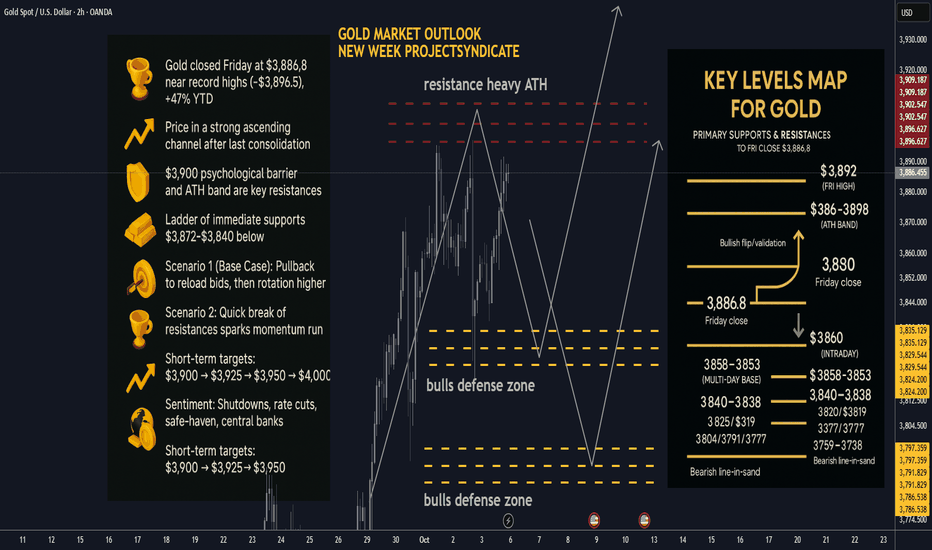
Nota
Gold Grid Trading Overview: Effective Strategy for 20% gains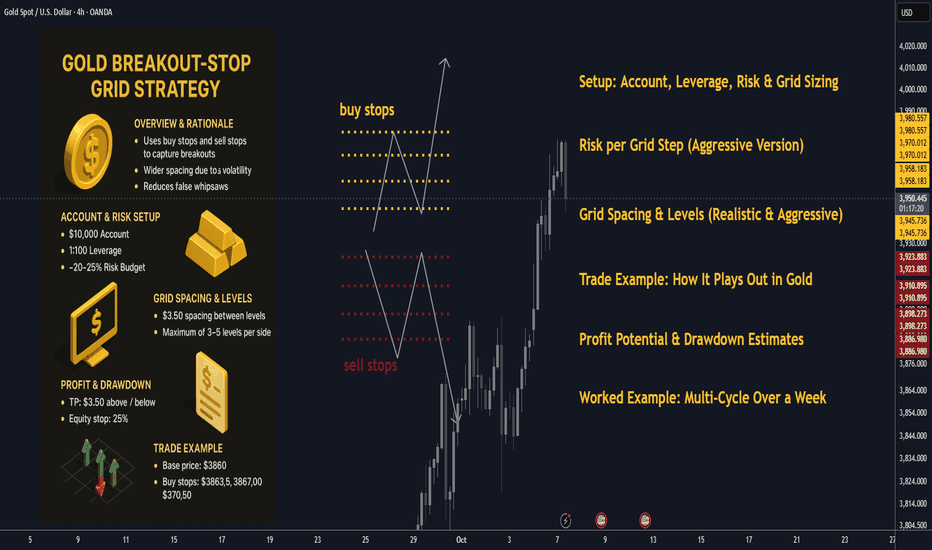
Trade ativo
KILLER BULL RUN IN PROGRESSNota
Gold Prices Overview of Primary Catalyst : October 2025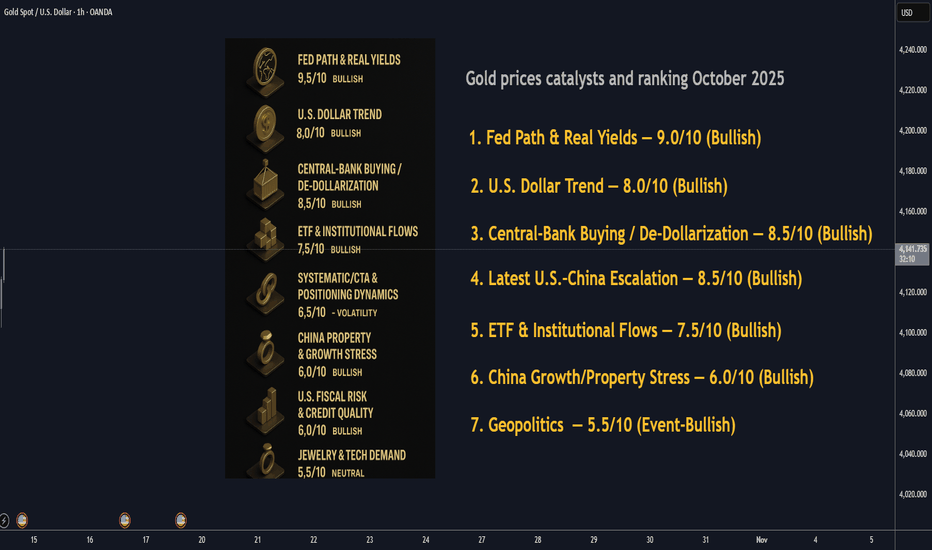
Nota
100% UPSIDE Precious Metals Playbook — Gold, Silver & Miners ETF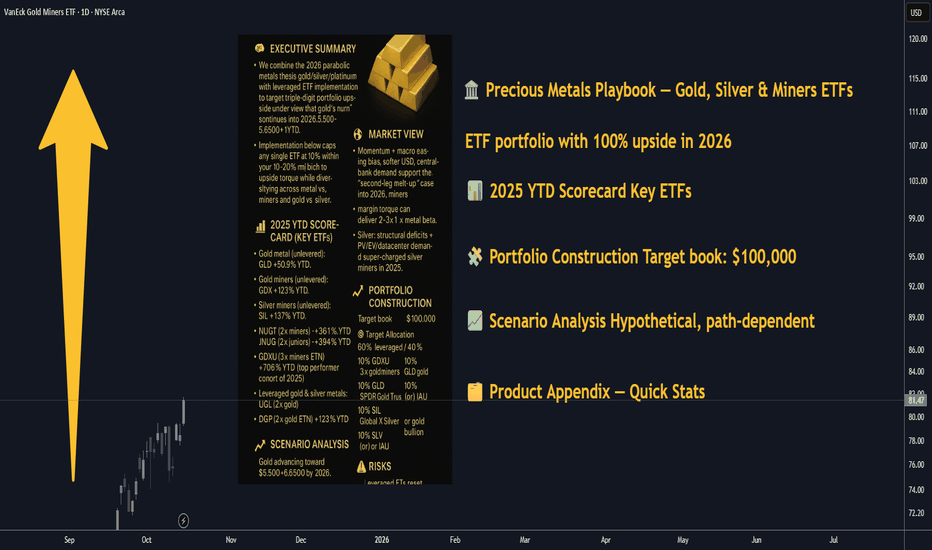
Nota
🔥 2026 Gold & Silver Supercycle — The Syndicate Metals Playbook 🔥🏛 1️⃣ Parabolic Setup: Gold eyeing $5,500–$6,500/oz by 2026 — 2025 already lit the fuse.
💰 2️⃣ Miner Torque: GDX +123% YTD, gold +51%; leveraged miners (NUGT, JNUG, GDXU) +360–700% — pure rocket fuel.
⚡ 3️⃣ Leverage Engine: Target mix = 60% leveraged (2×/3×) + 40% unlevered exposure.
🔱 4️⃣ Top Performers 2025: GDXU +706%, NUGT +361%, JNUG +394%, AGQ +159%, UGL +125%.
📈 5️⃣ Base Case: Gold +40–60% → portfolio ~+100% potential (if trend smooth).
🚀 6️⃣ Stretch Case: Miners keep over-beta → +200% portfolio upside if 3× exposure compounds cleanly.
🧠 7️⃣ Risk Reality: Leveraged ETFs reset daily — whipsaws hurt. Cap each ETF at 10% max; diversify metals vs. miners.
💎 8️⃣ Allocation Blueprint: 10% each: GDXU, NUGT, JNUG, AGQ, UGL, DGP, GDX, GLD, SIL, SLV (or IAU).
🧭 9️⃣ Execution Tips: Stagger entries, trade liquid hours, rebalance monthly ±3–5%; expect deep pullbacks (>60% on 3×).
⚠️ 🔟 Disclosure: Info only. Leveraged products = high risk, high reward — know your tolerance before chasing gold’s next leg.
Nota
🔱 GOLD WEEKLY OUTLOOK |  XAUUSD by ProjectSyndicate
Spot gold now trades near ATH (~$4,230 USD) — fresh highs, strong bullish breakout above $4,000.
Current Price: ~$4,230 USD (just set new all-time high this week)
📈 Momentum: Bullish thrust — gold broke above $4,000 cleanly; dip buyers remain aggressive.
🔝 Key Resistance Zones:
$4,230–$4,260 (near-ATH cluster)
$4,300–$4,350 (extension target zone)
Above that, $4,400+ is the ambitious breakout ceiling
🛡 Support Zones:
$4,200–$4,170 (near prior breakout retest)
$4,140–$4,100
$4,000–$3,980
⚖️ Base Case Scenario:
Expect shallow pullbacks into $4,170–$4,100 to be bought — then retest ATH zone.
🚀 Breakout Trigger:
A sustained move above ~$4,260 opens room for $4,300 → $4,350+.
💡 Market Drivers:
Geopolitics, Fed rate cut bets, central bank bullion demand, USD softness.
🔓 Bull / Bear Trigger Lines:
Bullish above $4,100–$4,140
Bearish below $4,000–$3,980
🧭 Strategy:
Accumulate on dips above $4,100. Target zones $4,300–$4,350+ on breakout. Maintain tight stops under support.
Nota
🔥 GOLD WEEKLY SNAPSHOT — BY PROJECTSYNDICATE 🏆 High/Close: $4,379 → ~$4,210 — orderly pullback after a vertical run.
📈 Trend: Uptrend intact above $4,000 key psych — dip-buyers still in control.
🛡 Supports: $4,120–$4,080 → $4,000 must hold.
🚧 Resistances: $4,300 / $4,350 / $4,380 → stretch $4,420.
🧭 Bias next week: Buy-the-dip > $4,000; momentum regain targets $4,300–$4,380+. Invalidation < $3,980 → risk $3,920/3,880.
🌍 Macro tailwinds:
• Fed cut odds into Oct 28–29 lift gold; “another 25bp” widely expected.
• DXY sub-99 = FX tailwind
• Record ETF inflows (Sep/Q3); AUM at highs.
• Central-bank demand & reserve shifts underpin dip-support.
🎯 Street view: Major houses now float $5,000/oz by 2026 (HSBC/BofA/SocGen).
Nota
🔥 GOLD WEEKLY SNAPSHOT — BY PROJECTSYNDICATE💰 Close: $4,379 → $4,252 — higher close, trend still strong.
📈 Trend: Uptrend > $4,000; dip buyers still in charge.
🛡 Supports: $4,180 → $4,000 (key line to defend).
🚧 Resistances: $4,260 / $4,300 / $4,350 → stretch $4,420.
🧭 Next Week Bias: Buy dips $4,140–$4,200 → target $4,300–$4,380+.
🏦 Macro Tailwinds: Fed cut bets + weak USD + CB gold demand.
🌍 Geopolitics: Trade & regional risks = safe-haven flows.
🎯 Street View: $5,000/oz by 2026 in play.
🚀 Breakout: >$4,280 → opens path to $4,350–$4,420.
⚖️ Strategy: Accumulate dips; protect under $4,050–$4,000.
Nota
Gold next week: Key S/R Levels and Outlook for Traders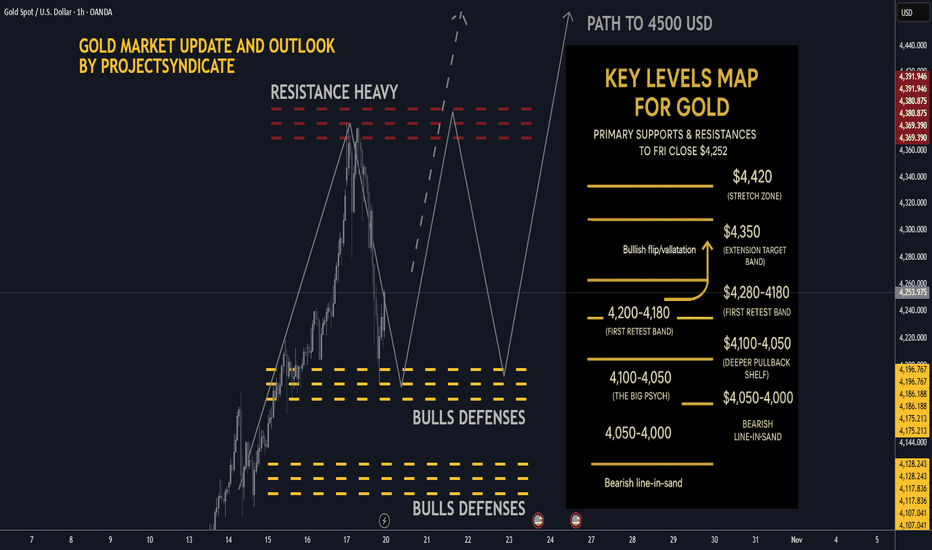

Institutional-desk research · 10+ yrs building trading algos stocks options FX
Algo systems for gold/FX traders · levels desk: Gold FX NQ ES JPN225
Private systems for serious traders
syndicate001.com
TG channel
t.me/aisyndicate001
Algo systems for gold/FX traders · levels desk: Gold FX NQ ES JPN225
Private systems for serious traders
syndicate001.com
TG channel
t.me/aisyndicate001
Publicações relacionadas
Aviso legal
As informações e publicações não se destinam a ser, e não constituem, conselhos ou recomendações financeiras, de investimento, comerciais ou de outro tipo fornecidos ou endossados pela TradingView. Leia mais nos Termos de Uso.
Institutional-desk research · 10+ yrs building trading algos stocks options FX
Algo systems for gold/FX traders · levels desk: Gold FX NQ ES JPN225
Private systems for serious traders
syndicate001.com
TG channel
t.me/aisyndicate001
Algo systems for gold/FX traders · levels desk: Gold FX NQ ES JPN225
Private systems for serious traders
syndicate001.com
TG channel
t.me/aisyndicate001
Publicações relacionadas
Aviso legal
As informações e publicações não se destinam a ser, e não constituem, conselhos ou recomendações financeiras, de investimento, comerciais ou de outro tipo fornecidos ou endossados pela TradingView. Leia mais nos Termos de Uso.