 XAUUSD
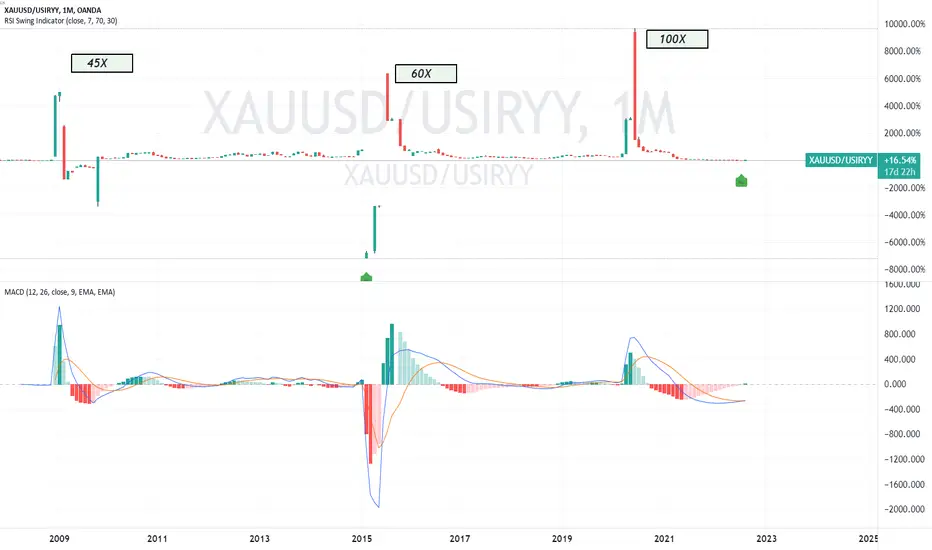
The MONTHLY chart shows the ratio between the spot gold price
and the US inflation rate.
While overall, the ratio is quite stable or consolidated for a period
of more than 15 years.
Hpwever. y three episodes are noted where the ratio rose parabolically
including 2009, 2015 and the Covid 2022 time period
.
For the present, the RSI Swing Indicator has printed a Buy Signal.
and
the MACD shows an early K/D crossover under the histogram.
Does this suggest an impending hard Bullrun for XAUUSD?
Please comment and offer your opinion.
XAUUSD
Aviso legal
As informações e publicações não se destinam a ser, e não constituem, conselhos ou recomendações financeiras, de investimento, comerciais ou de outro tipo fornecidos ou endossados pela TradingView. Leia mais nos Termos de Uso.
Aviso legal
As informações e publicações não se destinam a ser, e não constituem, conselhos ou recomendações financeiras, de investimento, comerciais ou de outro tipo fornecidos ou endossados pela TradingView. Leia mais nos Termos de Uso.