
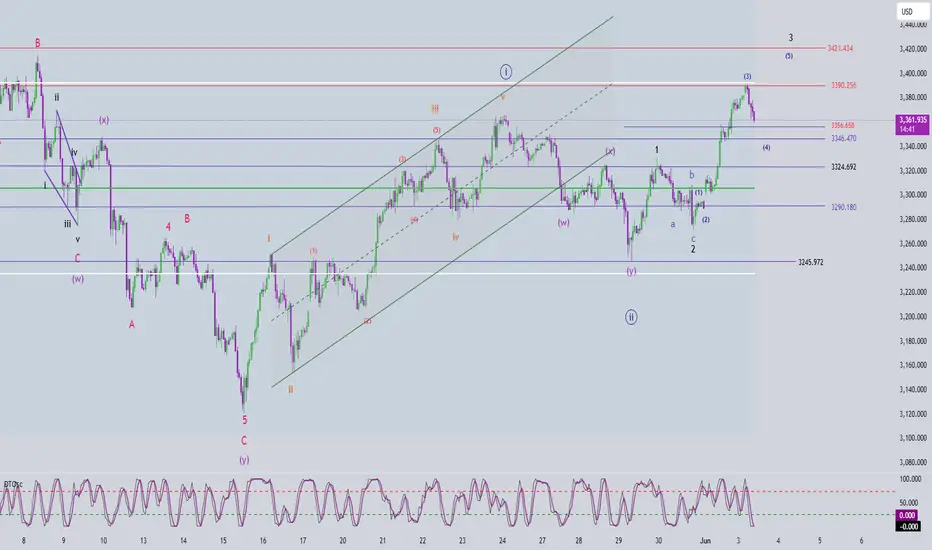
🌀 Current Wave Structure
On the chart, we’re observing a 5-wave green structure within wave 3 (black). Wave 3 (green) has been completed, and the market is now forming wave 4 (green).
👉 Since wave 3 was an extended move, wave 4 is likely to be a quick, shallow correction. The ‘a’ leg of the correction has formed, and we’re expecting a bounce into wave b next.
📍Wave 4 Target Zones
Potential Buy Zone (Swing): Around 3346, based on the 0.382 Fibonacci retracement and key liquidity zone from Volume Profile.
Potential Short-Term Sell Zone: Around 3390, if wave b forms a retracement rally.
⚠️ However, this sell idea may be invalidated if a zigzag, flat, or triangle structure forms before price reaches the zone.
⚡️ Momentum Outlook
D1: Bullish momentum → supports continued upward impulse wave structure.
H4: Bearish momentum → price may continue correcting to complete wave 4.
H1: Momentum nearing a bullish reversal → likely short-term rally toward 3390 (short-term sell opportunity).
📈 Trading Plan
🔻 Short-Term Sell Setup
• Entry: 3387 – 3390
• Stop Loss: 3395
• Take Profit:
– TP1: 3368
– TP2: 3356
🔺 Swing Buy Setup
• Entry: 3347 – 3344
• Stop Loss: 3337
• Take Profit:
– TP1: 3367
– TP2: 3390
– TP3: 3421
🎯 Strategy Summary:
Focus on short-term sell opportunities if price retraces into resistance and shows reversal signals. At the same time, monitor the 3344–3347 area for a potential swing buy if wave 4 completes with a clear corrective pattern.
Trade ativo
Momentum update & price expectationWith H4 momentum, we need at least one more H4 candle for the indicator to reach the oversold zone. Meanwhile, H1 momentum is already in the oversold region.
This suggests that during the remainder of the European session, we expect the price to consolidate or slightly correct at the current level, then rise sharply to the 3379 zone, and finally drop back to the 3346 area to complete the abc corrective wave within wave 4.
Trade fechado: objetivo atingido
🌀 Indecisive phase – Observation is the best strategyCurrently, the market is hesitating between two opposing scenarios. Therefore, it’s essential to wait for confirmation signals before executing a trade.
Scenario 1: Wave 2 (green) is complete
Price is now forming Wave 1 (red) within Wave 3 (green).
Confirmation needed: Break above 3356.
If price breaks 3356, wait for a retest of the 3356 level to look for a buy breakout entry in alignment with Wave 3.
Scenario 2: Wave 2 (green) is not yet complete
The recent rally might be Wave B (green), and Wave A (green) has already ended.
Price is expected to continue falling to form Wave C (green).
Confirmation needed: Break below 3346 or 3332.
Once confirmed, look for a target zone of Wave C to buy with the trend.
⏳ Conclusion:
At this stage, the market is not offering a clear setup. In such uncertain conditions, staying out of the market and waiting for clarity is often the wisest choice to protect capital and maintain trading discipline.

📢 Sometimes signals appear on TradingView with a slight delay!
🚀 Join our Telegram channel to get instant updates and real-time scalping signals:
👉 t.me/+lASNLyXKqcFiYmJl
🚀 Join our Telegram channel to get instant updates and real-time scalping signals:
👉 t.me/+lASNLyXKqcFiYmJl
Aviso legal
As informações e publicações não se destinam a ser, e não constituem, conselhos ou recomendações financeiras, de investimento, comerciais ou de outro tipo fornecidos ou endossados pela TradingView. Leia mais nos Termos de Uso.
📢 Sometimes signals appear on TradingView with a slight delay!
🚀 Join our Telegram channel to get instant updates and real-time scalping signals:
👉 t.me/+lASNLyXKqcFiYmJl
🚀 Join our Telegram channel to get instant updates and real-time scalping signals:
👉 t.me/+lASNLyXKqcFiYmJl
Aviso legal
As informações e publicações não se destinam a ser, e não constituem, conselhos ou recomendações financeiras, de investimento, comerciais ou de outro tipo fornecidos ou endossados pela TradingView. Leia mais nos Termos de Uso.