
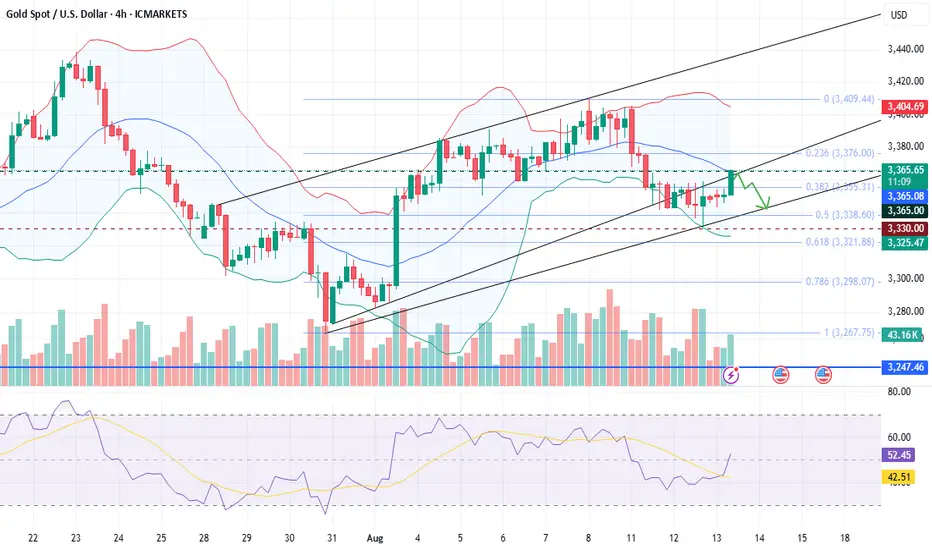
Price Action: Gold's primary bullish trend has paused, with prices consolidating between $3342 and $3360 on the 4-hour chart since Monday. Despite a recent rise due to a weaker dollar, strong resistance at $3365 and an ascending trendline halted the rally. A potential correction could occur if prices fall below the $3355 Fibonacci level.
Biasness: Gold is benefiting from a weaker U.S. dollar after soft inflation data boosted expectations for a Fed rate cut. Lower rates increase gold’s attractiveness as a non-yielding asset. Political uncertainty in the U.S. further supports safe-haven demand.
Key Levels: R1- 3365 R2- 3400
S1- 3350 S2- 3330
Technical Analysis: Prices are testing the middle Bollinger band near strong resistance at $3365. The RSI also rose strongly, signaling exhaustion of bullish strength. Overall, technical indicators are signaling bearish pressure building
Data Releases: With no major data releases today, traders are focused on tomorrow’s U.S. PPI report. Gold stays supported as rate cut expectations and dollar weakness maintain bullish sentiment.
Alternative Scenario: If Gold rise above the crucial resistance level of 3365, then it could signal bullishness.
While writing the report, gold is trending at 3359
Biasness: Gold is benefiting from a weaker U.S. dollar after soft inflation data boosted expectations for a Fed rate cut. Lower rates increase gold’s attractiveness as a non-yielding asset. Political uncertainty in the U.S. further supports safe-haven demand.
Key Levels: R1- 3365 R2- 3400
S1- 3350 S2- 3330
Technical Analysis: Prices are testing the middle Bollinger band near strong resistance at $3365. The RSI also rose strongly, signaling exhaustion of bullish strength. Overall, technical indicators are signaling bearish pressure building
Data Releases: With no major data releases today, traders are focused on tomorrow’s U.S. PPI report. Gold stays supported as rate cut expectations and dollar weakness maintain bullish sentiment.
Alternative Scenario: If Gold rise above the crucial resistance level of 3365, then it could signal bullishness.
While writing the report, gold is trending at 3359

Aviso legal
As informações e publicações não se destinam a ser, e não constituem, conselhos ou recomendações financeiras, de investimento, comerciais ou de outro tipo fornecidos ou endossados pela TradingView. Leia mais nos Termos de Uso.
Aviso legal
As informações e publicações não se destinam a ser, e não constituem, conselhos ou recomendações financeiras, de investimento, comerciais ou de outro tipo fornecidos ou endossados pela TradingView. Leia mais nos Termos de Uso.