
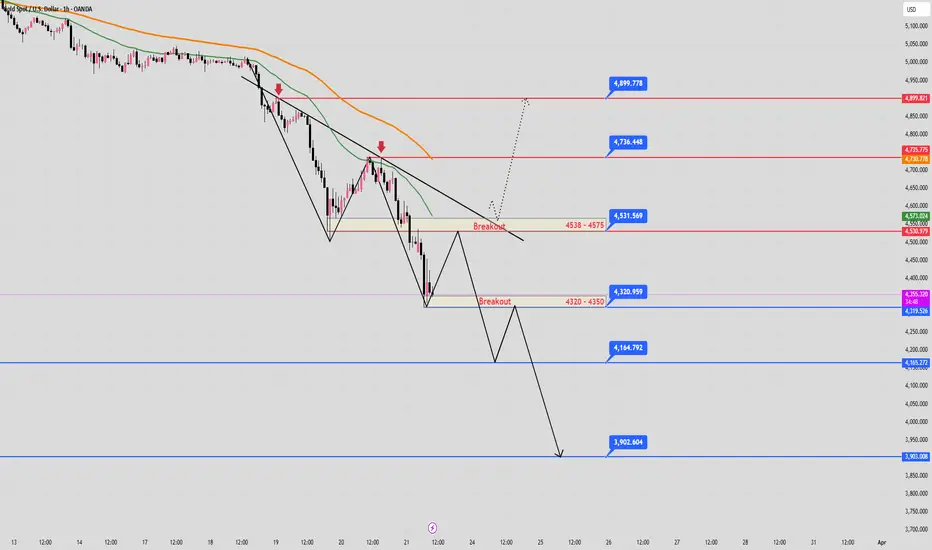
- The current market structure maintains a medium-term downtrend as prices continuously form a series of Lower Highs - Lower Lows, and the price is fluctuating, forming a clear downward trendline, indicating that selling pressure remains dominant.
- On larger timeframes, the bearish DOW pattern is firmly confirmed. The multi-timeframe EMA system (H4 - H2 - H1) is showing a bearish consensus as EMA34 is below EMA89, reflecting that downward momentum remains strong and sellers continue to control the market.
- The (4538 - 4575) zone is currently a crucial resistance area in the current technical uptrend; a breakout of this zone would trigger a short-term rebound to (4738 and further to 4900). The (4320 - 4350) zone is currently a crucial support area; a break of this zone would open up a further and wider downtrend in the market.
✅ VIEW:
1. SELL SCENARIO:
- Price retraces to the Resistance zone (4538 - 4575) and a price rejection signal (falsebreak, M5 - M15 reversal candle) appears.
- Price still respects the descending trendline and the confluence of EMA34 (H1).
- The zone (4538 - 4575) is an important resistance zone because it forms a bearish downtrend structure and the confluence of the Fibonacci retracement zone (0.618 - 0.5).
=> If the sellers strongly push the price down without a retest of the resistance and a breakout of the support zone (4320 - 4350), gold may continue to fall further and expand more sharply.
2. BUY SCENARIO:
- The candle (H1) confirms the breakout of the resistance zone (4538 - 4575).
- Confirmation of a breakout above the descending trendline and a candle closing above the EMA34 (H1).
- Simultaneously confirming a breakout above the Lower High and a breakout above the descending DOW structure.
=> If all the above factors are present, there is a possibility that the short-term uptrend will resume and head towards the (4738) and further (4900) zones.
SELL LIMIT GOLD: 4456 - 4458
STOPLOSS: 4462
✅TP1: 4453
✅TP2: 4422
SELL LIMIT GOLD: 4538 - 4540
STOPLOSS: 4545
✅TP1: 4535
✅TP2: 4505
- On larger timeframes, the bearish DOW pattern is firmly confirmed. The multi-timeframe EMA system (H4 - H2 - H1) is showing a bearish consensus as EMA34 is below EMA89, reflecting that downward momentum remains strong and sellers continue to control the market.
- The (4538 - 4575) zone is currently a crucial resistance area in the current technical uptrend; a breakout of this zone would trigger a short-term rebound to (4738 and further to 4900). The (4320 - 4350) zone is currently a crucial support area; a break of this zone would open up a further and wider downtrend in the market.
✅ VIEW:
1. SELL SCENARIO:
- Price retraces to the Resistance zone (4538 - 4575) and a price rejection signal (falsebreak, M5 - M15 reversal candle) appears.
- Price still respects the descending trendline and the confluence of EMA34 (H1).
- The zone (4538 - 4575) is an important resistance zone because it forms a bearish downtrend structure and the confluence of the Fibonacci retracement zone (0.618 - 0.5).
=> If the sellers strongly push the price down without a retest of the resistance and a breakout of the support zone (4320 - 4350), gold may continue to fall further and expand more sharply.
2. BUY SCENARIO:
- The candle (H1) confirms the breakout of the resistance zone (4538 - 4575).
- Confirmation of a breakout above the descending trendline and a candle closing above the EMA34 (H1).
- Simultaneously confirming a breakout above the Lower High and a breakout above the descending DOW structure.
=> If all the above factors are present, there is a possibility that the short-term uptrend will resume and head towards the (4738) and further (4900) zones.
SELL LIMIT GOLD: 4456 - 4458
STOPLOSS: 4462
✅TP1: 4453
✅TP2: 4422
SELL LIMIT GOLD: 4538 - 4540
STOPLOSS: 4545
✅TP1: 4535
✅TP2: 4505

Publicações relacionadas
Aviso legal
As informações e publicações não se destinam a ser, e não constituem, conselhos ou recomendações financeiras, de investimento, comerciais ou de outro tipo fornecidos ou endossados pela TradingView. Leia mais nos Termos de Uso.
Publicações relacionadas
Aviso legal
As informações e publicações não se destinam a ser, e não constituem, conselhos ou recomendações financeiras, de investimento, comerciais ou de outro tipo fornecidos ou endossados pela TradingView. Leia mais nos Termos de Uso.