
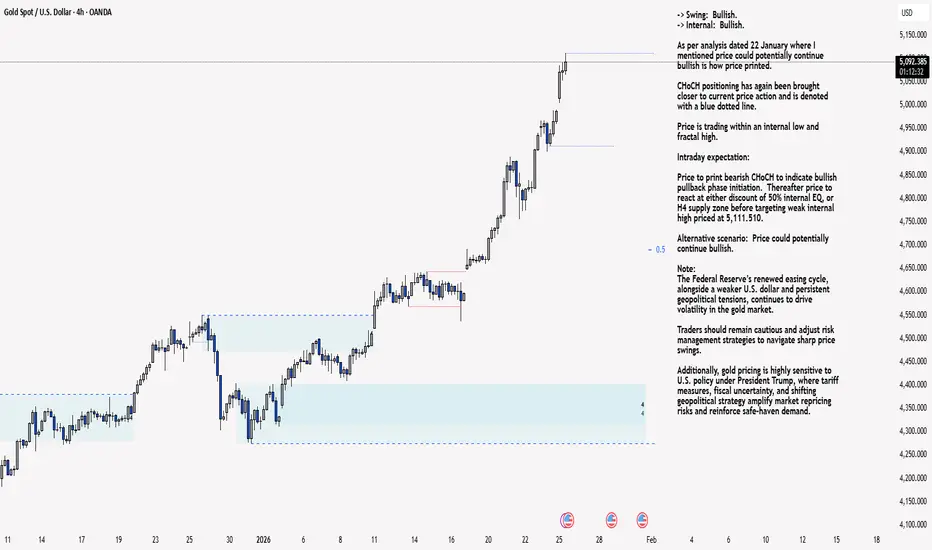
H4 Analysis:
-> Swing: Bullish.
-> Internal: Bullish.
As per analysis dated 22 January where I mentioned price could potentially continue bullish is how price printed.
CHoCH positioning has again been brought closer to current price action and is denoted with a blue dotted line.
Price is trading within an internal low and fractal high.
Intraday expectation:
Price to print bearish CHoCH to indicate bullish pullback phase initiation. Thereafter price to react at either discount of 50% internal EQ, or H4 supply zone before targeting weak internal high priced at 5,111.510.
Alternative scenario: Price could potentially continue bullish.
Note:
The Federal Reserve’s renewed easing cycle, alongside a weaker U.S. dollar and persistent geopolitical tensions, continues to drive volatility in the gold market.
Traders should remain cautious and adjust risk management strategies to navigate sharp price swings.
Additionally, gold pricing is highly sensitive to U.S. policy under President Trump, where tariff measures, fiscal uncertainty, and shifting geopolitical strategy amplify market repricing risks and reinforce safe‑haven demand.
H4 Chart:
M15 Analysis:
-> Swing: Bullish.
-> Internal: Bullish.
Price has printed as per analysis dated 23 January 2026 by printing a bullish iBOS.
Price has printed a bearish CHoCH, with price subsequently continuing to print higher, however, due to the very insignificant depth of pullback, I will apply discretion and not classify previous iBOS, this has been marked in red.
Price is currently trading within an internal low and fractal high.
Intraday expectation:
Price to print bearish CHoCH, to indicate, but not confirm bearish pullback phase initiation. Price to then trade down to either M15 or H4 demand zone, or discount of 50% internal EQ before targeting weak internal high, priced at 5,111,510.
Alternative scenario: Price could potentially print a bearish iBOS as all HTF's require pullback.
Note:
Gold continues to exhibit elevated volatility as markets digest the Federal Reserve’s ongoing dovish tilt and persistent global geopolitical tensions.
With uncertainty remaining a dominant theme across global risk assets, traders should prioritise disciplined risk management, as abrupt price swings and liquidity pockets may become increasingly common.
Furthermore, recent tariff announcements from President Trump, particularly those directed at China, have added another layer of instability to the macro landscape. These policy developments have the potential to intensify market turbulence, heighten risk‑off flows, and trigger sharp intraday reversals or whipsaw‑like behaviour in gold.
M15 Chart:
-> Swing: Bullish.
-> Internal: Bullish.
As per analysis dated 22 January where I mentioned price could potentially continue bullish is how price printed.
CHoCH positioning has again been brought closer to current price action and is denoted with a blue dotted line.
Price is trading within an internal low and fractal high.
Intraday expectation:
Price to print bearish CHoCH to indicate bullish pullback phase initiation. Thereafter price to react at either discount of 50% internal EQ, or H4 supply zone before targeting weak internal high priced at 5,111.510.
Alternative scenario: Price could potentially continue bullish.
Note:
The Federal Reserve’s renewed easing cycle, alongside a weaker U.S. dollar and persistent geopolitical tensions, continues to drive volatility in the gold market.
Traders should remain cautious and adjust risk management strategies to navigate sharp price swings.
Additionally, gold pricing is highly sensitive to U.S. policy under President Trump, where tariff measures, fiscal uncertainty, and shifting geopolitical strategy amplify market repricing risks and reinforce safe‑haven demand.
H4 Chart:
M15 Analysis:
-> Swing: Bullish.
-> Internal: Bullish.
Price has printed as per analysis dated 23 January 2026 by printing a bullish iBOS.
Price has printed a bearish CHoCH, with price subsequently continuing to print higher, however, due to the very insignificant depth of pullback, I will apply discretion and not classify previous iBOS, this has been marked in red.
Price is currently trading within an internal low and fractal high.
Intraday expectation:
Price to print bearish CHoCH, to indicate, but not confirm bearish pullback phase initiation. Price to then trade down to either M15 or H4 demand zone, or discount of 50% internal EQ before targeting weak internal high, priced at 5,111,510.
Alternative scenario: Price could potentially print a bearish iBOS as all HTF's require pullback.
Note:
Gold continues to exhibit elevated volatility as markets digest the Federal Reserve’s ongoing dovish tilt and persistent global geopolitical tensions.
With uncertainty remaining a dominant theme across global risk assets, traders should prioritise disciplined risk management, as abrupt price swings and liquidity pockets may become increasingly common.
Furthermore, recent tariff announcements from President Trump, particularly those directed at China, have added another layer of instability to the macro landscape. These policy developments have the potential to intensify market turbulence, heighten risk‑off flows, and trigger sharp intraday reversals or whipsaw‑like behaviour in gold.
M15 Chart:

Aviso legal
As informações e publicações não se destinam a ser, e não constituem, conselhos ou recomendações financeiras, de investimento, comerciais ou de outro tipo fornecidos ou endossados pela TradingView. Leia mais nos Termos de Uso.
Aviso legal
As informações e publicações não se destinam a ser, e não constituem, conselhos ou recomendações financeiras, de investimento, comerciais ou de outro tipo fornecidos ou endossados pela TradingView. Leia mais nos Termos de Uso.