
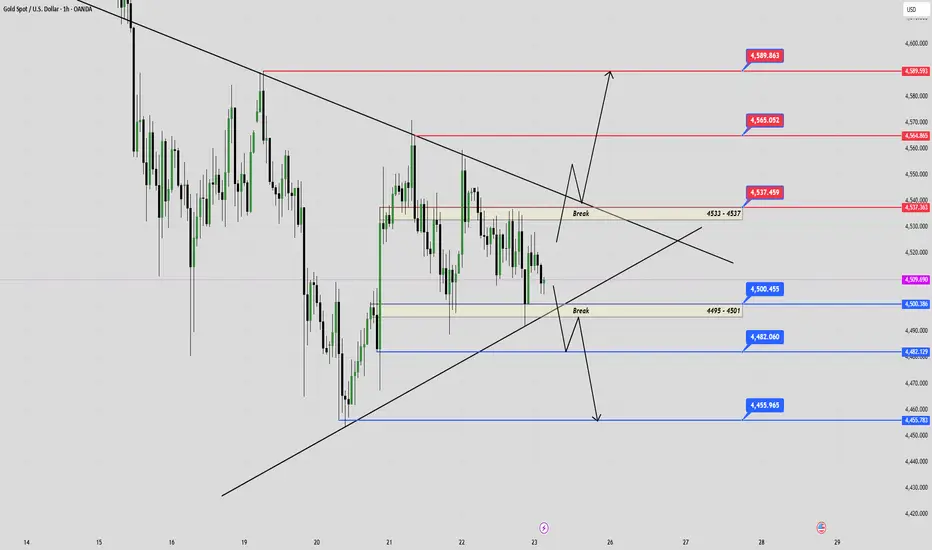
- XAUUSD/H1: Last week, the market fluctuated sideways, consolidating within the trendline channel and closing the weekly candle near the nearest support zone (4495 - 4501). The multi-timeframe EMA (H4 - H2 - H1) indicates that the current trend is still leaning towards a downtrend, with EMA34 below EMA89.
- The (4533 - 4537) zone is the nearest resistance zone and confluence of the downtrend line. If this zone is broken, the uptrend will resume. The (4495 - 4501) zone is a crucial support zone; if sellers break through this zone and the uptrend line, the downtrend will begin.
✅ VIEW
1. SELL SCENARIO:
- If gold shows a upward gap and recovers to the resistance zone (4533 - 4537), wait for a confirmation candle to break and close above this resistance zone (avoid false breakouts).
=> If the price breaks out falsely and closes below the resistance zone (4533 - 4537) while still respecting the downtrend line, prioritize finding a sell opportunity in line with the current downtrend.
= The target is to move back towards the sideways range of last week (451x - 450x).
= When the price breaks out and closes below the support zone (4495 - 4501) and simultaneously breaks the uptrend line, the downtrend will extend towards lower support levels (448x and 445x).
= The support zone (4453 - 4457) is the crucial area for determining how deeply the selling momentum extends.
2. BUY SCENARIO:
- A weekly candle closing above the near support zone (4495 - 4501) while still respecting the uptrend line indicates that buyers are still defending the price well.
- Along with positive US-Iran news at the end of the week, which is supporting a rise in gold prices, the upward momentum is controllable; just one negative piece of news could immediately push gold down.
=> If the market opens with an upward gap at the beginning of the week, wait for a candle on a larger timeframe to confirm the breakout and close above the resistance zone (4533 - 4537) and simultaneously break the downtrend line. Then, the short-term upward momentum will recover towards higher resistance levels (456x and 458x).
⚠️The market is likely to be impacted by news about the US-Iran conflict at the end of the week, showing positive signs of negotiations as both sides may reach a preliminary agreement... potentially creating an upward gap.
=>However, the current technical structure still leans towards a decline, with multi-timeframe EMAs all pointing downwards and the price still fluctuating below the downtrend line and key resistance zones. The price range (4533 - 4537) is a crucial zone; if it fails to break through the continuing strong downtrend, then a complete breakout would clearly confirm the return of buyers in the short term.
- The (4533 - 4537) zone is the nearest resistance zone and confluence of the downtrend line. If this zone is broken, the uptrend will resume. The (4495 - 4501) zone is a crucial support zone; if sellers break through this zone and the uptrend line, the downtrend will begin.
✅ VIEW
1. SELL SCENARIO:
- If gold shows a upward gap and recovers to the resistance zone (4533 - 4537), wait for a confirmation candle to break and close above this resistance zone (avoid false breakouts).
=> If the price breaks out falsely and closes below the resistance zone (4533 - 4537) while still respecting the downtrend line, prioritize finding a sell opportunity in line with the current downtrend.
= The target is to move back towards the sideways range of last week (451x - 450x).
= When the price breaks out and closes below the support zone (4495 - 4501) and simultaneously breaks the uptrend line, the downtrend will extend towards lower support levels (448x and 445x).
= The support zone (4453 - 4457) is the crucial area for determining how deeply the selling momentum extends.
2. BUY SCENARIO:
- A weekly candle closing above the near support zone (4495 - 4501) while still respecting the uptrend line indicates that buyers are still defending the price well.
- Along with positive US-Iran news at the end of the week, which is supporting a rise in gold prices, the upward momentum is controllable; just one negative piece of news could immediately push gold down.
=> If the market opens with an upward gap at the beginning of the week, wait for a candle on a larger timeframe to confirm the breakout and close above the resistance zone (4533 - 4537) and simultaneously break the downtrend line. Then, the short-term upward momentum will recover towards higher resistance levels (456x and 458x).
⚠️The market is likely to be impacted by news about the US-Iran conflict at the end of the week, showing positive signs of negotiations as both sides may reach a preliminary agreement... potentially creating an upward gap.
=>However, the current technical structure still leans towards a decline, with multi-timeframe EMAs all pointing downwards and the price still fluctuating below the downtrend line and key resistance zones. The price range (4533 - 4537) is a crucial zone; if it fails to break through the continuing strong downtrend, then a complete breakout would clearly confirm the return of buyers in the short term.

Aviso legal
As informações e publicações não se destinam a ser, e não constituem, conselhos ou recomendações financeiras, de investimento, comerciais ou de outro tipo fornecidos ou endossados pela TradingView. Leia mais nos Termos de Uso.
Aviso legal
As informações e publicações não se destinam a ser, e não constituem, conselhos ou recomendações financeiras, de investimento, comerciais ou de outro tipo fornecidos ou endossados pela TradingView. Leia mais nos Termos de Uso.