📊 Technical Structure
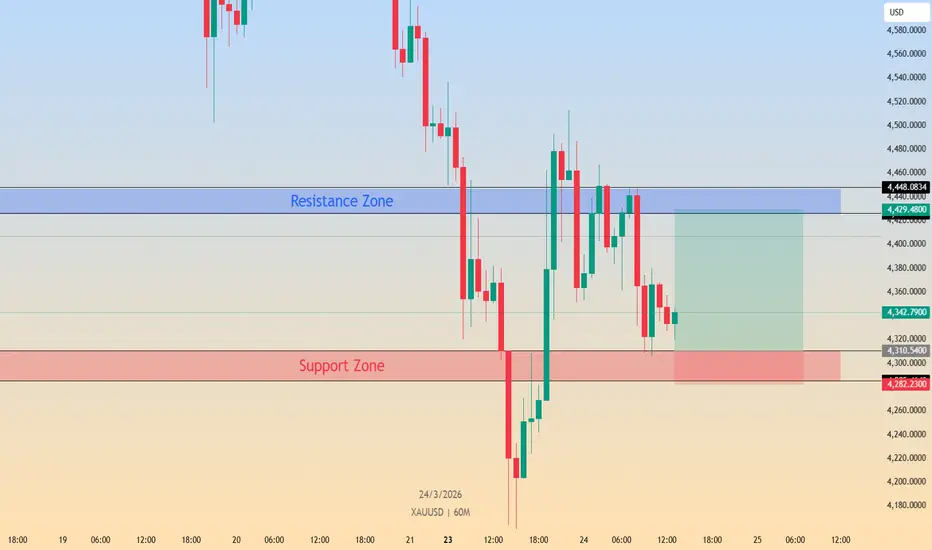
 XAUUSD On the 60-minute (60M) chart dated March 24, 2026, Gold (XAU/USD) is currently testing a significant horizontal Support Zone between $4,285 – $4,310. Despite the broader ten-day bearish streak, the price is seeing a localized stall near the $4,310 handle, which previously acted as a structural floor.
On the upside, the primary Resistance Zone is situated between $4,429 – $4,448. The current price action suggests a potential oversold bounce as the metal stabilizes above the $4,285 level, providing a tactical window for a buy-on-support play ahead of the global flash PMI data.
Short-term bias: Neutral/Bullish while holding above $4,285.
Key Resistance: $4,429 – $4,448.
Key Support: $4,282.23 – $4,310.54.
🎯 Trade Setup (Buy-on-Support Scenario)
Entry Zone: $4,285 – $4,310 (Accumulating long positions within the primary horizontal support floor).
Stop Loss: $4,282 (Placed strictly below the structural support floor to manage risk).
Take Profit 1: $4,360 (Immediate liquidity area).
Take Profit 2: $4,448 (Bottom of the primary resistance zone).
Risk–Reward Ratio: Approx. 1:4.2
📌 Invalidation: A decisive hourly candle close below $4,282 would invalidate the bullish support thesis, suggesting that the fundamental pressure from rising yields and the closed Strait of Hormuz has forced a deeper technical breakdown.
🌐 Macro Background
The fundamental landscape for Gold remains complex, balanced between geopolitical risk and hawkish monetary shifts:
Strait of Hormuz & Oil: The effective closure of the Strait and renewed pressure on Iranian energy infrastructure have kept Crude Oil prices elevated, fueling global inflation concerns.
Fed Rate Path: Markets have nearly priced out further Fed rate cuts, with increasing bets for a hike by year-end. This has boosted US Treasury yields and the US Dollar (USD), capping Gold’s upside.
Geopolitical Hedge: Despite the dollar's strength, the continuation of the US-Israel conflict with Iran provides an underlying safe-haven floor, preventing a total collapse of the metal's price at current support levels.
Flash PMIs: Traders are awaiting the release of global flash PMIs for a fresh catalyst regarding the health of the global economy amidst the energy shock.
🔑 Key Technical Levels
Resistance Zone: $4,429 – $4,448.
Support Zone: $4,285 – $4,310.
📌 Trade Summary
Gold is currently positioned at a critical technical juncture. While the macro environment remains hostile for non-yielding assets, the $4,285 – $4,310 zone offers a high-confluence area for a technical rebound. Defending this floor is essential for bulls to prevent a slide toward the $4,100 long-term SMA.
Preferred strategy: Seek long entries within the $4,300 neighbourhood, targeting a move back toward the $4,448 resistance level.
⚠️ Disclaimer
This analysis is for reference only and does not constitute trading advice. Financial markets involve significant risk; proper risk and position management are essential.
XAUUSD On the 60-minute (60M) chart dated March 24, 2026, Gold (XAU/USD) is currently testing a significant horizontal Support Zone between $4,285 – $4,310. Despite the broader ten-day bearish streak, the price is seeing a localized stall near the $4,310 handle, which previously acted as a structural floor.On the upside, the primary Resistance Zone is situated between $4,429 – $4,448. The current price action suggests a potential oversold bounce as the metal stabilizes above the $4,285 level, providing a tactical window for a buy-on-support play ahead of the global flash PMI data.
Short-term bias: Neutral/Bullish while holding above $4,285.
Key Resistance: $4,429 – $4,448.
Key Support: $4,282.23 – $4,310.54.
🎯 Trade Setup (Buy-on-Support Scenario)
Entry Zone: $4,285 – $4,310 (Accumulating long positions within the primary horizontal support floor).
Stop Loss: $4,282 (Placed strictly below the structural support floor to manage risk).
Take Profit 1: $4,360 (Immediate liquidity area).
Take Profit 2: $4,448 (Bottom of the primary resistance zone).
Risk–Reward Ratio: Approx. 1:4.2
📌 Invalidation: A decisive hourly candle close below $4,282 would invalidate the bullish support thesis, suggesting that the fundamental pressure from rising yields and the closed Strait of Hormuz has forced a deeper technical breakdown.
🌐 Macro Background
The fundamental landscape for Gold remains complex, balanced between geopolitical risk and hawkish monetary shifts:
Strait of Hormuz & Oil: The effective closure of the Strait and renewed pressure on Iranian energy infrastructure have kept Crude Oil prices elevated, fueling global inflation concerns.
Fed Rate Path: Markets have nearly priced out further Fed rate cuts, with increasing bets for a hike by year-end. This has boosted US Treasury yields and the US Dollar (USD), capping Gold’s upside.
Geopolitical Hedge: Despite the dollar's strength, the continuation of the US-Israel conflict with Iran provides an underlying safe-haven floor, preventing a total collapse of the metal's price at current support levels.
Flash PMIs: Traders are awaiting the release of global flash PMIs for a fresh catalyst regarding the health of the global economy amidst the energy shock.
🔑 Key Technical Levels
Resistance Zone: $4,429 – $4,448.
Support Zone: $4,285 – $4,310.
📌 Trade Summary
Gold is currently positioned at a critical technical juncture. While the macro environment remains hostile for non-yielding assets, the $4,285 – $4,310 zone offers a high-confluence area for a technical rebound. Defending this floor is essential for bulls to prevent a slide toward the $4,100 long-term SMA.
Preferred strategy: Seek long entries within the $4,300 neighbourhood, targeting a move back toward the $4,448 resistance level.
⚠️ Disclaimer
This analysis is for reference only and does not constitute trading advice. Financial markets involve significant risk; proper risk and position management are essential.

ATFX is a globally regulated, award-winning fintech broker offering customer support in 20 languages.
👉🏼Start your trading journey with ATFX: bit.ly/3mLMPHz
👉🏼Start your trading journey with ATFX: bit.ly/3mLMPHz
Aviso legal
As informações e publicações não se destinam a ser, e não constituem, conselhos ou recomendações financeiras, de investimento, comerciais ou de outro tipo fornecidos ou endossados pela TradingView. Leia mais nos Termos de Uso.
ATFX is a globally regulated, award-winning fintech broker offering customer support in 20 languages.
👉🏼Start your trading journey with ATFX: bit.ly/3mLMPHz
👉🏼Start your trading journey with ATFX: bit.ly/3mLMPHz
Aviso legal
As informações e publicações não se destinam a ser, e não constituem, conselhos ou recomendações financeiras, de investimento, comerciais ou de outro tipo fornecidos ou endossados pela TradingView. Leia mais nos Termos de Uso.