
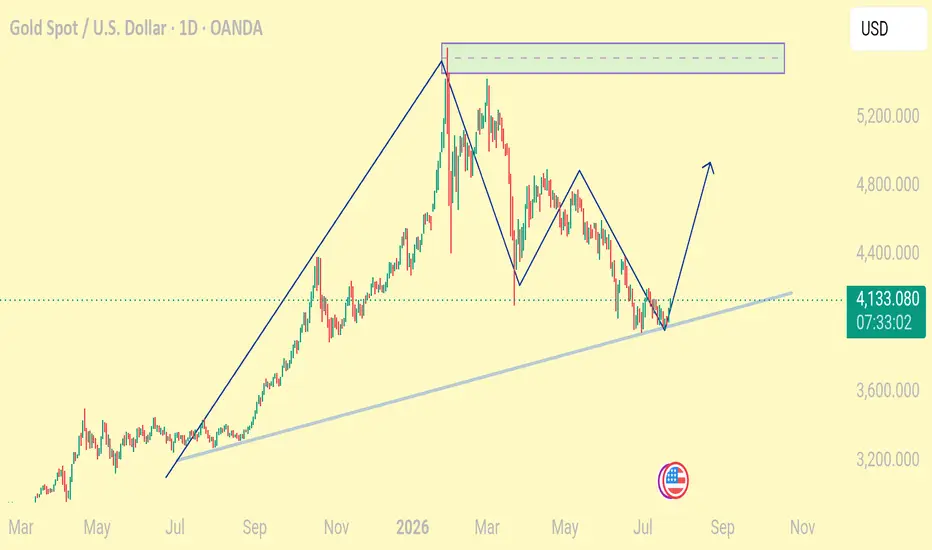
The chart is a 1-Day (1D) Gold Spot / U.S. Dollar (XAU/USD) chart with a hand-drawn technical analysis. Based on the visible price action:
Chart Summary
Current Price: Around 4,132 USD
Trend: Long-term uptrend remains intact because price is still above the rising trendline (light blue).
Recent Pattern: Price has been making lower highs and lower lows after the all-time high, forming a corrective downtrend.
Key Technical Levels
Major Resistance: 5,300–5,500 USD (purple highlighted supply zone).
Immediate Support: 4,050–4,100 USD (where price is currently bouncing from the ascending trendline).
Next Support: Around 3,900–4,000 USD if the trendline breaks.
What the Drawing Suggests
The analyst expects the current bounce from the ascending trendline to continue.
If buyers hold above the trendline and break the recent lower high near 4,500–4,600 USD, the price could target:
4,800 USD
5,000 USD
Eventually retest the 5,300–5,500 USD resistance zone.
Bullish Scenario
Trendline support holds.
Daily candles close above 4,500–4,600 USD.
Momentum increases toward previous highs.
Bearish Scenario
A daily close below the ascending trendline (around 4,050 USD) would weaken the bullish outlook.
Price could then decline toward 3,900 USD or lower before finding stronger support.
Overall, this chart presents a bullish rebound idea, but confirmation would come from a break above the recent swing highs. Until then, the market is still recovering from its correction.
Chart Summary
Current Price: Around 4,132 USD
Trend: Long-term uptrend remains intact because price is still above the rising trendline (light blue).
Recent Pattern: Price has been making lower highs and lower lows after the all-time high, forming a corrective downtrend.
Key Technical Levels
Major Resistance: 5,300–5,500 USD (purple highlighted supply zone).
Immediate Support: 4,050–4,100 USD (where price is currently bouncing from the ascending trendline).
Next Support: Around 3,900–4,000 USD if the trendline breaks.
What the Drawing Suggests
The analyst expects the current bounce from the ascending trendline to continue.
If buyers hold above the trendline and break the recent lower high near 4,500–4,600 USD, the price could target:
4,800 USD
5,000 USD
Eventually retest the 5,300–5,500 USD resistance zone.
Bullish Scenario
Trendline support holds.
Daily candles close above 4,500–4,600 USD.
Momentum increases toward previous highs.
Bearish Scenario
A daily close below the ascending trendline (around 4,050 USD) would weaken the bullish outlook.
Price could then decline toward 3,900 USD or lower before finding stronger support.
Overall, this chart presents a bullish rebound idea, but confirmation would come from a break above the recent swing highs. Until then, the market is still recovering from its correction.

Aviso legal
As informações e publicações não se destinam a ser, e não constituem, conselhos ou recomendações financeiras, de investimento, comerciais ou de outro tipo fornecidos ou endossados pela TradingView. Leia mais nos Termos de Uso.
Aviso legal
As informações e publicações não se destinam a ser, e não constituem, conselhos ou recomendações financeiras, de investimento, comerciais ou de outro tipo fornecidos ou endossados pela TradingView. Leia mais nos Termos de Uso.