
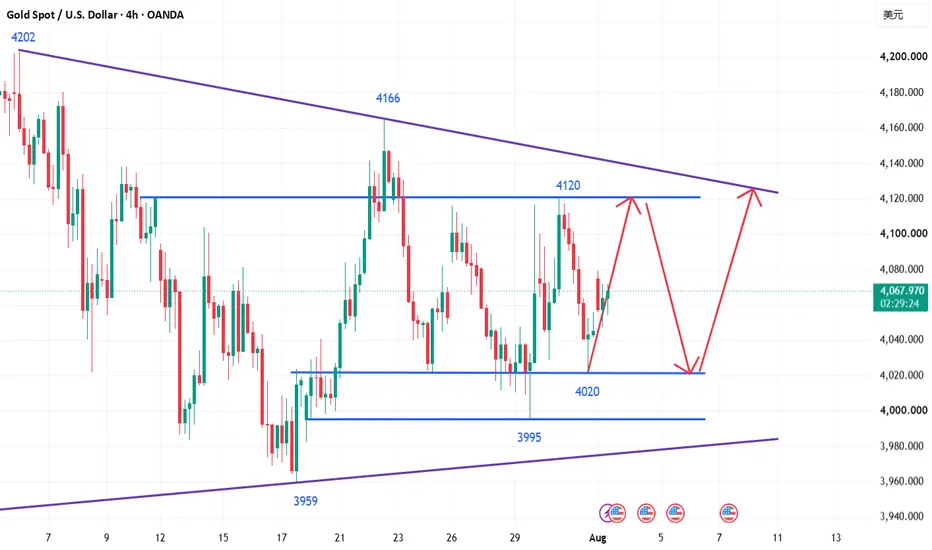
Tensions between the US and Iran eased somewhat over the weekend, reducing market risk aversion. Gold prices gapped up on Monday, boosted by the news. However, the biggest characteristic of gold recently has been the lack of sustained upward momentum; each surge has been followed by a pullback. Today's price action was no exception, with prices rising and then falling back again, indicating that the market has not yet formed a clear one-sided trend and is still generally fluctuating. This week is a week of important data releases, and whether the data can provide a new catalyst for gold to break the current balance remains to be seen.
From a daily chart perspective, gold is still in a consolidation phase, with prices steadily trading above short-term moving averages. The 4000 level remains a strong support, and the bearish momentum following the previous rapid decline has been largely released. The market is gradually entering a stabilization and recovery phase. However, the 4100-4120 area presents significant resistance, with multiple attempts by bulls failing to break through effectively. This indicates that selling pressure in this area remains heavy, limiting short-term upward momentum. The market still needs time to digest the previous rebound.
From a 4-hour chart perspective, after breaking below the previous consolidation range, gold prices found support and stabilized around 4020. While the Bollinger Bands remain downward-sloping, they show signs of narrowing. Short-term moving averages remain in a bearish alignment, and price rebounds are consistently suppressed by the MA5 and MA10 moving averages, indicating that the short-term trend has not yet fully strengthened.
It is worth noting that the area around 4020 is also a significant area of high trading volume in the previous period. Coupled with the fundamental support of continued gold purchases by global central banks, the room for further sharp declines in gold is relatively limited. Therefore, in the short term, it is more likely to maintain a volatile bottoming trend rather than directly start a new round of one-sided market movement.
In terms of operations, the overall strategy remains range trading. The key support level to watch remains the 4020-4000 area. If the price retraces and stabilizes, there may be opportunities to buy on dips. On the upside, the key resistance level to watch is the 4100-4120 area. Without a decisive breakout, any rebound should be approached with caution as it may face downward pressure. Only if the price truly breaks through and holds above the 4200 level can the upside potential for gold on the daily chart be further unlocked.
From a daily chart perspective, gold is still in a consolidation phase, with prices steadily trading above short-term moving averages. The 4000 level remains a strong support, and the bearish momentum following the previous rapid decline has been largely released. The market is gradually entering a stabilization and recovery phase. However, the 4100-4120 area presents significant resistance, with multiple attempts by bulls failing to break through effectively. This indicates that selling pressure in this area remains heavy, limiting short-term upward momentum. The market still needs time to digest the previous rebound.
From a 4-hour chart perspective, after breaking below the previous consolidation range, gold prices found support and stabilized around 4020. While the Bollinger Bands remain downward-sloping, they show signs of narrowing. Short-term moving averages remain in a bearish alignment, and price rebounds are consistently suppressed by the MA5 and MA10 moving averages, indicating that the short-term trend has not yet fully strengthened.
It is worth noting that the area around 4020 is also a significant area of high trading volume in the previous period. Coupled with the fundamental support of continued gold purchases by global central banks, the room for further sharp declines in gold is relatively limited. Therefore, in the short term, it is more likely to maintain a volatile bottoming trend rather than directly start a new round of one-sided market movement.
In terms of operations, the overall strategy remains range trading. The key support level to watch remains the 4020-4000 area. If the price retraces and stabilizes, there may be opportunities to buy on dips. On the upside, the key resistance level to watch is the 4100-4120 area. Without a decisive breakout, any rebound should be approached with caution as it may face downward pressure. Only if the price truly breaks through and holds above the 4200 level can the upside potential for gold on the daily chart be further unlocked.
Trade ativo
Having traded for many years, I've always followed an ironclad rule: use larger timeframes to determine direction, and smaller timeframes to find entry points. The market is always cycling through periods of ups and downs, and consolidation is a common tactic used by major players to shake out retail investors. Never let short-term daily fluctuations disrupt your weekly chart strategy. Currently, the battle between bulls and bears is fierce, with the market repeatedly pulling in and out of its trading range. The more it consolidates within this range, the more crucial it is to adhere to the following principles: before breaking key support levels, don't chase the downtrend; before breaking strong resistance levels, don't blindly chase the uptrend. Only by clearly understanding the wave cycles and the rhythm of the bull-bear battle can you preserve profits and avoid the risk of repeated stop-losses during periods of consolidation.Trade fechado: objetivo atingido
If you lack the ability to flexibly adapt to the market and cannot adjust your trading mindset and pace in a timely manner, you can pay attention to the bottom notifications to obtain more specific operational details and strategy updates. Let's work together to flexibly and steadily pursue more opportunities in the ever-changing market!
Publicações relacionadas
Aviso legal
As informações e publicações não se destinam a ser, e não constituem, conselhos ou recomendações financeiras, de investimento, comerciais ou de outro tipo fornecidos ou endossados pela TradingView. Leia mais nos Termos de Uso.
Publicações relacionadas
Aviso legal
As informações e publicações não se destinam a ser, e não constituem, conselhos ou recomendações financeiras, de investimento, comerciais ou de outro tipo fornecidos ou endossados pela TradingView. Leia mais nos Termos de Uso.