Short
XAUUSD (4H timeframe) technical analysis based on your chart
Current Market Price
Sell Price: 3,354.08
Buy Price: 3,354.29
Very tight spread, indicating high liquidity.
Indicators Used
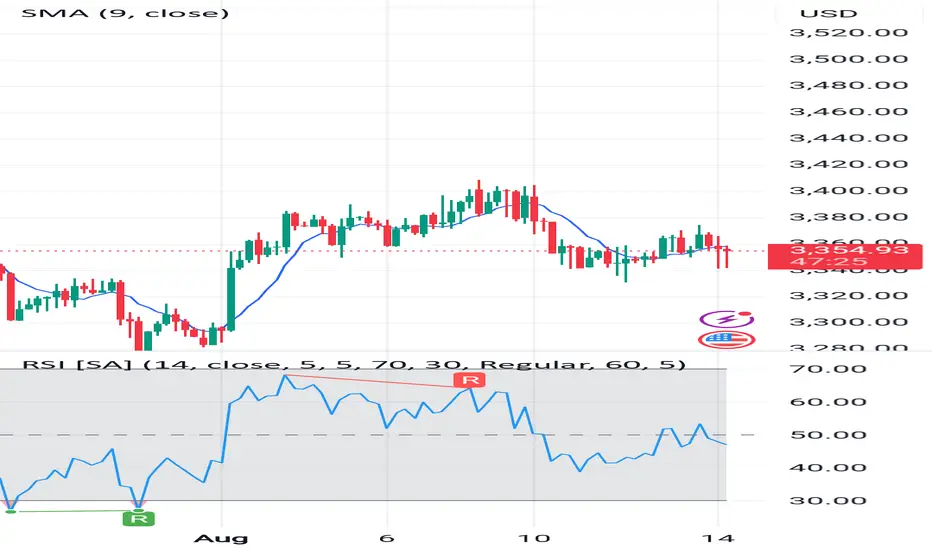
SMA (9-period) – Price is currently below the SMA, suggesting short-term bearish momentum.
RSI (14) – Currently around ~50, indicating a neutral zone (neither overbought nor oversold).
Recent RSI Trend – It recently dropped from ~65 to ~45, showing weakening buying pressure.
Price Action
Recent price movement shows:
A sharp drop from ~3,400 to ~3,325.
A small recovery attempt, but failing to break above SMA 9, showing sellers are still in control.
Candlestick patterns show lower highs and lower lows, a classic bearish sign.
Support & Resistance Levels
Immediate Resistance: ~3,375 (SMA 9 area & recent rejection zone).
Immediate Support: ~3,325 (recent bounce area).
Major Resistance: ~3,400
Major Support: ~3,300
Signal
Trend Bias: Bearish in short term.
Momentum: Weak buying strength, sellers still dominant.
Recommendation: SELL
Entry: Around 3,354–3,360 (current price zone).
Stop Loss: Above 3,375 (above SMA & last swing high).
Take Profit 1: 3,325 (near-term support).
Take Profit 2: 3,300 (major support zone).
Risk Management
Risk–Reward ratio target: at least 1:2.
Avoid over-leverage; gold can move fast on news.
📌 Summary:
The market shows weakness after a failed recovery. Price staying below SMA 9 and RSI losing momentum indicates sellers are in control. Unless price breaks above 3,375 with strong volume, the bias remains short-term bearish.
Sell Price: 3,354.08
Buy Price: 3,354.29
Very tight spread, indicating high liquidity.
Indicators Used
SMA (9-period) – Price is currently below the SMA, suggesting short-term bearish momentum.
RSI (14) – Currently around ~50, indicating a neutral zone (neither overbought nor oversold).
Recent RSI Trend – It recently dropped from ~65 to ~45, showing weakening buying pressure.
Price Action
Recent price movement shows:
A sharp drop from ~3,400 to ~3,325.
A small recovery attempt, but failing to break above SMA 9, showing sellers are still in control.
Candlestick patterns show lower highs and lower lows, a classic bearish sign.
Support & Resistance Levels
Immediate Resistance: ~3,375 (SMA 9 area & recent rejection zone).
Immediate Support: ~3,325 (recent bounce area).
Major Resistance: ~3,400
Major Support: ~3,300
Signal
Trend Bias: Bearish in short term.
Momentum: Weak buying strength, sellers still dominant.
Recommendation: SELL
Entry: Around 3,354–3,360 (current price zone).
Stop Loss: Above 3,375 (above SMA & last swing high).
Take Profit 1: 3,325 (near-term support).
Take Profit 2: 3,300 (major support zone).
Risk Management
Risk–Reward ratio target: at least 1:2.
Avoid over-leverage; gold can move fast on news.
📌 Summary:
The market shows weakness after a failed recovery. Price staying below SMA 9 and RSI losing momentum indicates sellers are in control. Unless price breaks above 3,375 with strong volume, the bias remains short-term bearish.

Aviso legal
As informações e publicações não se destinam a ser, e não constituem, conselhos ou recomendações financeiras, de investimento, comerciais ou de outro tipo fornecidos ou endossados pela TradingView. Leia mais nos Termos de Uso.
Aviso legal
As informações e publicações não se destinam a ser, e não constituem, conselhos ou recomendações financeiras, de investimento, comerciais ou de outro tipo fornecidos ou endossados pela TradingView. Leia mais nos Termos de Uso.