
📊 Market Structure
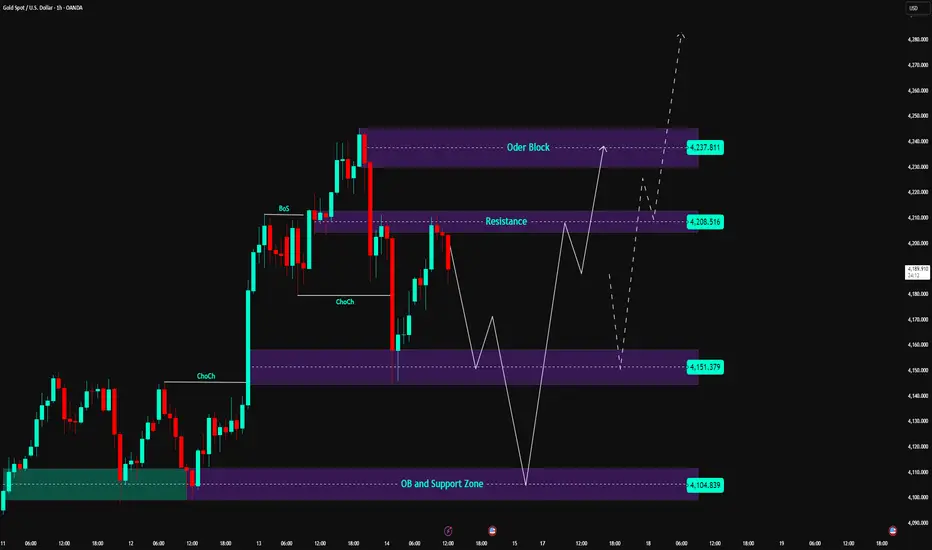
After the Break of Structure (BoS) at the 4,208 USD zone, gold confirms the continuation of the upward trend and is forming a technical adjustment.
The price has touched the Resistance Zone of 4,208 – 4,237 USD and is currently adjusting as expected, heading towards the Support Zone of 4,151 USD – this is where a previous impulsive move originated.
Below the 4,151 Support, there is a strong OB at 4,104 USD.
As long as the price does not break deeply below 4,104 USD, the bullish structure remains intact.
💎 Key Technical Zones
• Resistance Zone: 4,208 – 4,237 USD → supply zone + area of bearish reaction
• Support Zone: 4,151 USD → area awaiting bullish reaction
• Strong OB + Support: 4,104 – 4,110 USD → base of bullish structure
• Liquidity Zone (Target): 4,260+ USD → area for the next wave expansion
🎯 Trading Plan
1️⃣ BUY Setup – Trend Following
If the price adjusts correctly to the discount zones:
• Entry 1: 4,151 USD
• Entry 2: 4,104 USD (most attractive zone – confluence OB)
SL: below 4,090 USD
TP1: 4,208
TP2: 4,237
TP3: 4,260
→ Main strategy: wait for pullback → re-enter the upward wave → follow the strong trend.
2️⃣ SELL Scalp – Reaction at Resistance (counter-trend)
If the price retests the 4,208 – 4,237 zone and creates a clear rejection:
Entry: 4,218 – 4,230
SL: 4,245
TP1: 4,180
TP2: 4,151
→ Setup only for flexible traders, short trades, no holding positions.
🧠 Vincent’s View
The current structure is very precise:
Impulsive Move → Short-term Distribution → Pullback to Support → Continuation of the upward wave.
The 4,151 USD zone is the focal point to observe.
The 4,104 USD zone is the most attractive BUY area if the market seeks deeper liquidity.
As long as the price does not break 4,104 USD, the buyers maintain complete advantage.
“Let the pullback come to you — structure always tells the truth.” ⚜️
⏰ Timeframe: 1H
📅 Updated: 14/11/2025
✍️ Analysis by: Captain Vincent
After the Break of Structure (BoS) at the 4,208 USD zone, gold confirms the continuation of the upward trend and is forming a technical adjustment.
The price has touched the Resistance Zone of 4,208 – 4,237 USD and is currently adjusting as expected, heading towards the Support Zone of 4,151 USD – this is where a previous impulsive move originated.
Below the 4,151 Support, there is a strong OB at 4,104 USD.
As long as the price does not break deeply below 4,104 USD, the bullish structure remains intact.
💎 Key Technical Zones
• Resistance Zone: 4,208 – 4,237 USD → supply zone + area of bearish reaction
• Support Zone: 4,151 USD → area awaiting bullish reaction
• Strong OB + Support: 4,104 – 4,110 USD → base of bullish structure
• Liquidity Zone (Target): 4,260+ USD → area for the next wave expansion
🎯 Trading Plan
1️⃣ BUY Setup – Trend Following
If the price adjusts correctly to the discount zones:
• Entry 1: 4,151 USD
• Entry 2: 4,104 USD (most attractive zone – confluence OB)
SL: below 4,090 USD
TP1: 4,208
TP2: 4,237
TP3: 4,260
→ Main strategy: wait for pullback → re-enter the upward wave → follow the strong trend.
2️⃣ SELL Scalp – Reaction at Resistance (counter-trend)
If the price retests the 4,208 – 4,237 zone and creates a clear rejection:
Entry: 4,218 – 4,230
SL: 4,245
TP1: 4,180
TP2: 4,151
→ Setup only for flexible traders, short trades, no holding positions.
🧠 Vincent’s View
The current structure is very precise:
Impulsive Move → Short-term Distribution → Pullback to Support → Continuation of the upward wave.
The 4,151 USD zone is the focal point to observe.
The 4,104 USD zone is the most attractive BUY area if the market seeks deeper liquidity.
As long as the price does not break 4,104 USD, the buyers maintain complete advantage.
“Let the pullback come to you — structure always tells the truth.” ⚜️
⏰ Timeframe: 1H
📅 Updated: 14/11/2025
✍️ Analysis by: Captain Vincent

Aviso legal
As informações e publicações não se destinam a ser, e não constituem, conselhos ou recomendações financeiras, de investimento, comerciais ou de outro tipo fornecidos ou endossados pela TradingView. Leia mais nos Termos de Uso.
Aviso legal
As informações e publicações não se destinam a ser, e não constituem, conselhos ou recomendações financeiras, de investimento, comerciais ou de outro tipo fornecidos ou endossados pela TradingView. Leia mais nos Termos de Uso.