
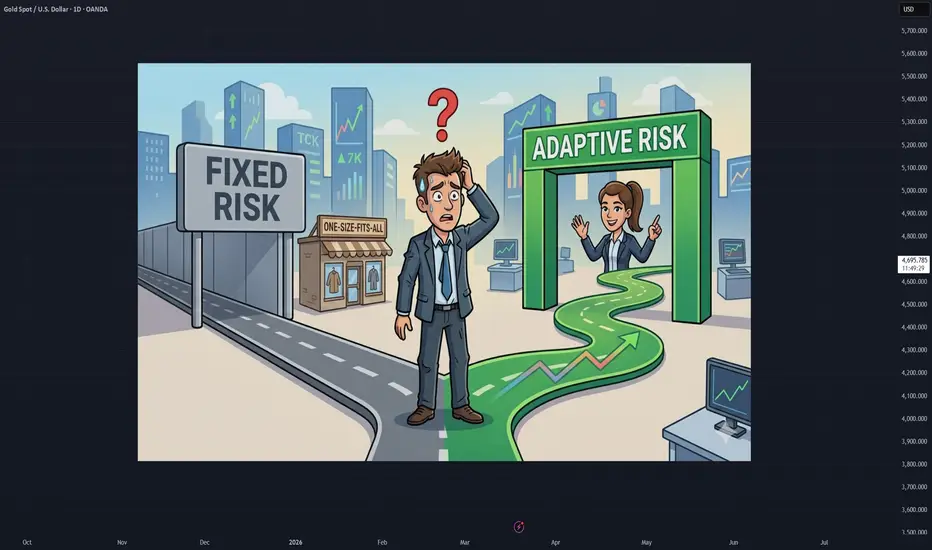
Why Fixed 1–2% Risk Is Not Enough: A Beginner's Guide to Adaptive Position Sizing
Introduction
If you have read any trading book or taken a course, you have probably heard: "Risk no more than 1–2% of your account per trade." That rule is widely used because it helps you survive losing streaks. But it has a flaw: it treats every trader and every strategy the same. A 1% risk might be too conservative for a strong edge, or too aggressive for a weak one.
This idea explains why adaptive risk (sizing based on your edge and your tolerance for consecutive losses) can help you grow faster while keeping the chance of blowing up your account low. The math comes from established work on position sizing (Kelly 1956, risk-of-ruin formulas) and is used by many professional traders.
---
The Problem with Fixed Risk
The 1–2% rule is a one-size-fits-all approach. It ignores two things that matter:
---
The Math (Simplified)
You do not need to memorize formulas, but understanding the basics helps.
1. Edge
Edge is your expected profit per dollar risked:
Pine Script®
Example: 30% win rate, 1:3 R:R → Edge = 0.30×3 − 0.70 = 0.20. Positive edge means the strategy is profitable in expectation.
2. Kelly Criterion
The Kelly criterion (Kelly 1956) gives the fraction of capital to risk that maximizes long-run growth. For trading:
Pine Script®
Full Kelly is often too aggressive and leads to large drawdowns. Professionals usually use Half Kelly or Quarter Kelly to reduce volatility.
3. Risk of Ruin
Risk of Ruin (RoR) is the probability of losing your entire account. A standard formula is:
Pine Script®
where r is risk per trade (as a fraction, e.g. 0.02 for 2%). The exponent 1/r corresponds to capital units-account size measured in "units of risk per trade"-so this assumes a very long series of independent bets with stable edge.
Important: doubling your risk per trade increases RoR more than linearly. Small changes in risk can have a big impact on survival.
Note: The classic RoR formula is an approximation. It tends to break down with skewed returns, changing bet sizes, fat tails, or finite trade counts. Balsara-style tables or Monte Carlo simulation are often more realistic for real-world portfolios.
4. Consecutive Losses
The probability of k losses in a row:
Pine Script®
For a 60% win rate, P(5) ≈ 1%, P(10) ≈ 0.01%. Over 100 trades, you might see 4–5 consecutive losses; over 1000 trades, 7–8.
5. Drawdown After k Losses
If you risk R% per trade, your account after k losses:
Pine Script®
At 2% risk, 10 losses in a row ≈ 18.3% drawdown. At 5% risk, 10 losses ≈ 40% drawdown.
---
Adaptive Risk in Practice
Instead of always using 1–2%, you can:
This is adaptive risk: your risk % changes with your edge and your tolerance for consecutive losses.
---
Examples
Example 1: 30% Win Rate, 1:3 R:R
Edge = 0.20 (positive). Full Kelly might be around 6.7%; Half Kelly ≈ 3.3%. If your target RoR is 0.0001%, the max risk might be lower (e.g., around 2-3%). The RoR comparison table shows how RoR jumps as risk increases.

Example 2: RoR at Different Risk Levels
At 1% risk, RoR might be negligible. At 5% or 10%, RoR can rise sharply. Seeing this table helps you choose a risk level you can live with.

Example 3: Consecutive Losses Cone
The cone visualizes P(k) and drawdown at different risk levels. The vertical line and dot show the best risk % for your chosen k and max drawdown limit.

Example 4: Low vs High Edge
A low-edge strategy (e.g., 45% WR, 1:1.3 R:R) has small or zero edge. A high-edge strategy (e.g., 30% WR, 1:3 R:R) can support higher risk. Adaptive sizing reflects this difference.


---
Takeaways
---
Disclaimer
This idea is for educational purposes only. It does not constitute investment advice. Past performance does not guarantee future results. The formulas and examples are simplified; real trading involves costs, slippage, uncertainty, and the RoR formula is an approximation that may not hold under skewed returns or finite horizons. Always do your own research and consider consulting a qualified financial advisor before trading.
Introduction
If you have read any trading book or taken a course, you have probably heard: "Risk no more than 1–2% of your account per trade." That rule is widely used because it helps you survive losing streaks. But it has a flaw: it treats every trader and every strategy the same. A 1% risk might be too conservative for a strong edge, or too aggressive for a weak one.
This idea explains why adaptive risk (sizing based on your edge and your tolerance for consecutive losses) can help you grow faster while keeping the chance of blowing up your account low. The math comes from established work on position sizing (Kelly 1956, risk-of-ruin formulas) and is used by many professional traders.
---
The Problem with Fixed Risk
The 1–2% rule is a one-size-fits-all approach. It ignores two things that matter:
- Your edge - A strategy with 50% win rate and 1:1 risk-reward has no edge. A strategy with 30% win rate and 1:3 risk-reward can have a strong edge. The same 1% risk does not fit both.
- Consecutive losses - Losing streaks happen. A 60% win rate still means about a 10% chance of 5 losses in a row over 100 trades. Fixed risk does not tell you how much you will lose if that happens.
Fixed risk is safe by default, but it can leave money on the table when you have a real edge, or expose you to more drawdown than you can stomach when your edge is weak.
---
The Math (Simplified)
You do not need to memorize formulas, but understanding the basics helps.
1. Edge
Edge is your expected profit per dollar risked:
Example: 30% win rate, 1:3 R:R → Edge = 0.30×3 − 0.70 = 0.20. Positive edge means the strategy is profitable in expectation.
2. Kelly Criterion
The Kelly criterion (Kelly 1956) gives the fraction of capital to risk that maximizes long-run growth. For trading:
Full Kelly is often too aggressive and leads to large drawdowns. Professionals usually use Half Kelly or Quarter Kelly to reduce volatility.
3. Risk of Ruin
Risk of Ruin (RoR) is the probability of losing your entire account. A standard formula is:
where r is risk per trade (as a fraction, e.g. 0.02 for 2%). The exponent 1/r corresponds to capital units-account size measured in "units of risk per trade"-so this assumes a very long series of independent bets with stable edge.
Important: doubling your risk per trade increases RoR more than linearly. Small changes in risk can have a big impact on survival.
Note: The classic RoR formula is an approximation. It tends to break down with skewed returns, changing bet sizes, fat tails, or finite trade counts. Balsara-style tables or Monte Carlo simulation are often more realistic for real-world portfolios.
4. Consecutive Losses
The probability of k losses in a row:
For a 60% win rate, P(5) ≈ 1%, P(10) ≈ 0.01%. Over 100 trades, you might see 4–5 consecutive losses; over 1000 trades, 7–8.
5. Drawdown After k Losses
If you risk R% per trade, your account after k losses:
At 2% risk, 10 losses in a row ≈ 18.3% drawdown. At 5% risk, 10 losses ≈ 40% drawdown.
---
Adaptive Risk in Practice
Instead of always using 1–2%, you can:
- Know your edge - Use win rate and R:R from your backtest or live stats.
- Set a target Risk of Ruin - e.g., 0.001% (almost zero chance of ruin). Solve for the max risk % that keeps RoR at or below that level.
- Set a max drawdown at k losses - e.g., "I do not want to lose more than 25% of my account if I hit 10 losses in a row." Solve for the max risk % that keeps drawdown at k within that limit.
- Use the stricter of the two - Your final risk % should satisfy both RoR and drawdown constraints.
This is adaptive risk: your risk % changes with your edge and your tolerance for consecutive losses.
---
Examples
Example 1: 30% Win Rate, 1:3 R:R
Edge = 0.20 (positive). Full Kelly might be around 6.7%; Half Kelly ≈ 3.3%. If your target RoR is 0.0001%, the max risk might be lower (e.g., around 2-3%). The RoR comparison table shows how RoR jumps as risk increases.
Example 2: RoR at Different Risk Levels
At 1% risk, RoR might be negligible. At 5% or 10%, RoR can rise sharply. Seeing this table helps you choose a risk level you can live with.
Example 3: Consecutive Losses Cone
The cone visualizes P(k) and drawdown at different risk levels. The vertical line and dot show the best risk % for your chosen k and max drawdown limit.
Example 4: Low vs High Edge
A low-edge strategy (e.g., 45% WR, 1:1.3 R:R) has small or zero edge. A high-edge strategy (e.g., 30% WR, 1:3 R:R) can support higher risk. Adaptive sizing reflects this difference.
---
Takeaways
- Fixed 1–2% risk is a safe default but does not adapt to your edge or drawdown tolerance.
- Edge, Kelly, Risk of Ruin, and consecutive-loss drawdown are the building blocks of adaptive sizing.
- Use your target RoR and max drawdown at k losses to solve for a risk % that fits your strategy and psychology.
- Fractional Kelly (Half or Quarter) is usually safer than Full Kelly.
- Tools like the Risk Management Calculator can automate these calculations.
---
Disclaimer
This idea is for educational purposes only. It does not constitute investment advice. Past performance does not guarantee future results. The formulas and examples are simplified; real trading involves costs, slippage, uncertainty, and the RoR formula is an approximation that may not hold under skewed returns or finite horizons. Always do your own research and consider consulting a qualified financial advisor before trading.

TradeVizion™
For our premium indicators! whop.com/tradevizion/
For our premium indicators! whop.com/tradevizion/
Aviso legal
As informações e publicações não se destinam a ser, e não constituem, conselhos ou recomendações financeiras, de investimento, comerciais ou de outro tipo fornecidos ou endossados pela TradingView. Leia mais nos Termos de Uso.
TradeVizion™
For our premium indicators! whop.com/tradevizion/
For our premium indicators! whop.com/tradevizion/
Aviso legal
As informações e publicações não se destinam a ser, e não constituem, conselhos ou recomendações financeiras, de investimento, comerciais ou de outro tipo fornecidos ou endossados pela TradingView. Leia mais nos Termos de Uso.