
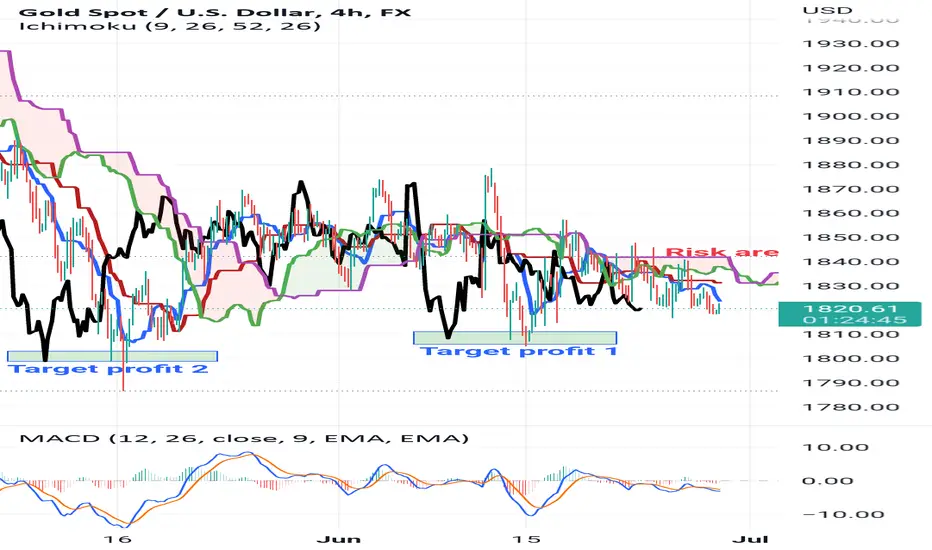
As we can see from 4H chart, from ichimoku indicator perspective, chikou span below the cloud, candle below the cloud, kijun above tenkan. It is indicating bearish market.
From MACD perspective it is below 0, which it is bearish market.
I also mark the risk area (red area) and possible taking profit area (blue color).
Happy trading. Manage your own risk and target.
From MACD perspective it is below 0, which it is bearish market.
I also mark the risk area (red area) and possible taking profit area (blue color).
Happy trading. Manage your own risk and target.

Aviso legal
As informações e publicações não se destinam a ser, e não constituem, conselhos ou recomendações financeiras, de investimento, comerciais ou de outro tipo fornecidos ou endossados pela TradingView. Leia mais nos Termos de Uso.
Aviso legal
As informações e publicações não se destinam a ser, e não constituem, conselhos ou recomendações financeiras, de investimento, comerciais ou de outro tipo fornecidos ou endossados pela TradingView. Leia mais nos Termos de Uso.