
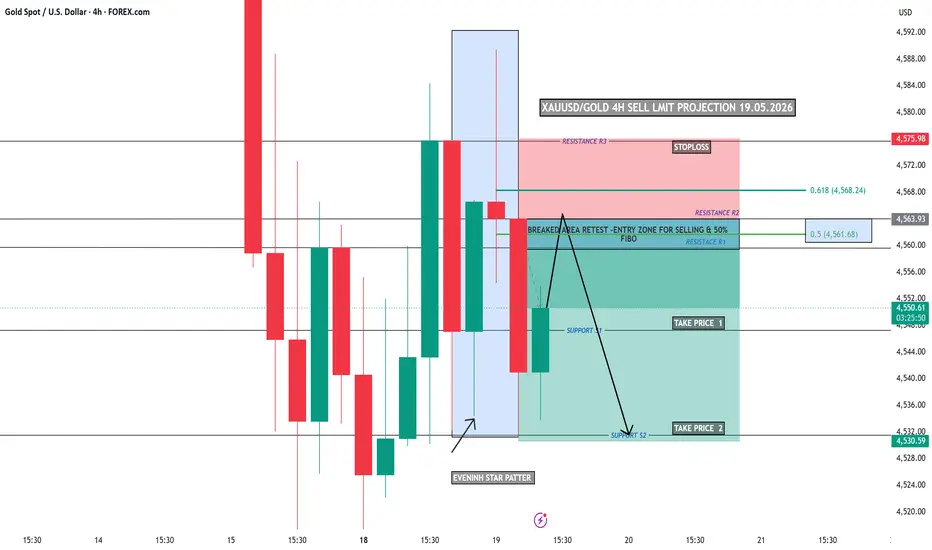
This chart shows a bearish reversal setup on the 4-hour timeframe after gold faced strong rejection from the resistance zone. The market previously created an aggressive bullish move, but now price action is slowing down near a key resistance area, increasing the probability of a short-term downside correction.
The setup is mainly based on:
Evening Star Pattern formation 🌟
Broken area retest concept
50% Fibonacci retracement zone
Multiple resistance confirmations (R1, R2, R3)
The marked blue zone around 4560 – 4563 is acting as the main sell entry area, where price is expected to retest previous structure before continuing downward. This zone also aligns with the 0.5 Fibonacci level, making it a strong confluence area for sellers.
The chart suggests that if price rejects this retest zone successfully, gold may continue moving bearish toward:
🎯 TP1: Around 4547
🎯 TP2: Around 4530
The red zone above 4575 is marked as the stoploss area, because a strong breakout above resistance would invalidate the bearish setup and could push gold higher again.
The setup is mainly based on:
Evening Star Pattern formation 🌟
Broken area retest concept
50% Fibonacci retracement zone
Multiple resistance confirmations (R1, R2, R3)
The marked blue zone around 4560 – 4563 is acting as the main sell entry area, where price is expected to retest previous structure before continuing downward. This zone also aligns with the 0.5 Fibonacci level, making it a strong confluence area for sellers.
The chart suggests that if price rejects this retest zone successfully, gold may continue moving bearish toward:
🎯 TP1: Around 4547
🎯 TP2: Around 4530
The red zone above 4575 is marked as the stoploss area, because a strong breakout above resistance would invalidate the bearish setup and could push gold higher again.

Aviso legal
As informações e publicações não se destinam a ser, e não constituem, conselhos ou recomendações financeiras, de investimento, comerciais ou de outro tipo fornecidos ou endossados pela TradingView. Leia mais nos Termos de Uso.
Aviso legal
As informações e publicações não se destinam a ser, e não constituem, conselhos ou recomendações financeiras, de investimento, comerciais ou de outro tipo fornecidos ou endossados pela TradingView. Leia mais nos Termos de Uso.