
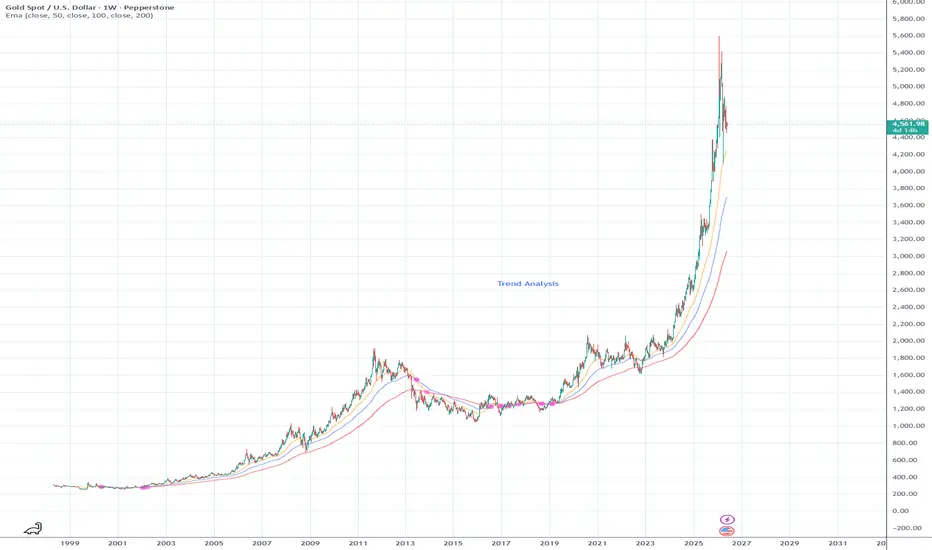
Gold ran from roughly USD 2,000 in early 2024 to a USD 5,600 ATH around late 2025 / early 2026. That is a 2.8x move in roughly 22 months, a textbook parabolic blow-off pattern. Recent weekly action printed a 27 percent drawdown into the USD 4,100 area before recovering to the current USD 4,554 (~19 percent off ATH).
Three macro drivers that pulled gold higher in this cycle have all shifted regime through 2026.
DXY has rolled over from the 2024-2025 105-plus regime into a 99-101 trading band. Gold benefits when USD weakens; this driver is currently a tailwind.
Real yields on the 10Y TIPS have come in from 2.1 percent toward 1.7 percent over the last two months. Gold benefits from falling real yields because it lowers the opportunity cost of holding a zero-yielding asset. Currently a tailwind.
Central bank purchasing remains at the elevated post-2022 baseline that absorbed roughly 1,000 tonnes annually for three consecutive years. Structural demand floor, not a marginal driver but a baseline that does not unwind quickly.
Technical structure on the weekly: price holding above the EMA 50, RSI no longer in extreme overbought (the 27 percent pullback unwound the parabolic overbought condition that read above 80 at the ATH). Weekly EMA 200 sits far below current price - the secular bull regime is intact.
The risk-skew bias worth flagging is the VIX-gold correlation flip that breaks down when VIX runs above 25 sustained. If equity volatility spikes through the Fed September meeting, RBA July decision, or US election windows, gold catches a flight-to-safety bid that decouples it from the real-yield mechanics described above.
For Australian retail traders specifically: XAU/USD is leveraged at 20:1 max under ASIC margin rules (commodity CFD bucket), tighter than the 30:1 on FX majors. Position-size around the tighter cap. Spread plus commission on most ASIC-licensed brokers runs around 30-40 cents per ounce all-in.
Bias: Neutral. Watching for either a confirmed higher low above USD 4,400-4,500 (parabolic-bull continuation thesis), or a rejection back below USD 4,200 (extended consolidation thesis). Either resolution likely tied to the next DXY directional move plus any flight-to-safety catalyst.
Three macro drivers that pulled gold higher in this cycle have all shifted regime through 2026.
DXY has rolled over from the 2024-2025 105-plus regime into a 99-101 trading band. Gold benefits when USD weakens; this driver is currently a tailwind.
Real yields on the 10Y TIPS have come in from 2.1 percent toward 1.7 percent over the last two months. Gold benefits from falling real yields because it lowers the opportunity cost of holding a zero-yielding asset. Currently a tailwind.
Central bank purchasing remains at the elevated post-2022 baseline that absorbed roughly 1,000 tonnes annually for three consecutive years. Structural demand floor, not a marginal driver but a baseline that does not unwind quickly.
Technical structure on the weekly: price holding above the EMA 50, RSI no longer in extreme overbought (the 27 percent pullback unwound the parabolic overbought condition that read above 80 at the ATH). Weekly EMA 200 sits far below current price - the secular bull regime is intact.
The risk-skew bias worth flagging is the VIX-gold correlation flip that breaks down when VIX runs above 25 sustained. If equity volatility spikes through the Fed September meeting, RBA July decision, or US election windows, gold catches a flight-to-safety bid that decouples it from the real-yield mechanics described above.
For Australian retail traders specifically: XAU/USD is leveraged at 20:1 max under ASIC margin rules (commodity CFD bucket), tighter than the 30:1 on FX majors. Position-size around the tighter cap. Spread plus commission on most ASIC-licensed brokers runs around 30-40 cents per ounce all-in.
Bias: Neutral. Watching for either a confirmed higher low above USD 4,400-4,500 (parabolic-bull continuation thesis), or a rejection back below USD 4,200 (extended consolidation thesis). Either resolution likely tied to the next DXY directional move plus any flight-to-safety catalyst.

Publicações relacionadas
Aviso legal
As informações e publicações não se destinam a ser, e não constituem, conselhos ou recomendações financeiras, de investimento, comerciais ou de outro tipo fornecidos ou endossados pela TradingView. Leia mais nos Termos de Uso.
Publicações relacionadas
Aviso legal
As informações e publicações não se destinam a ser, e não constituem, conselhos ou recomendações financeiras, de investimento, comerciais ou de outro tipo fornecidos ou endossados pela TradingView. Leia mais nos Termos de Uso.