
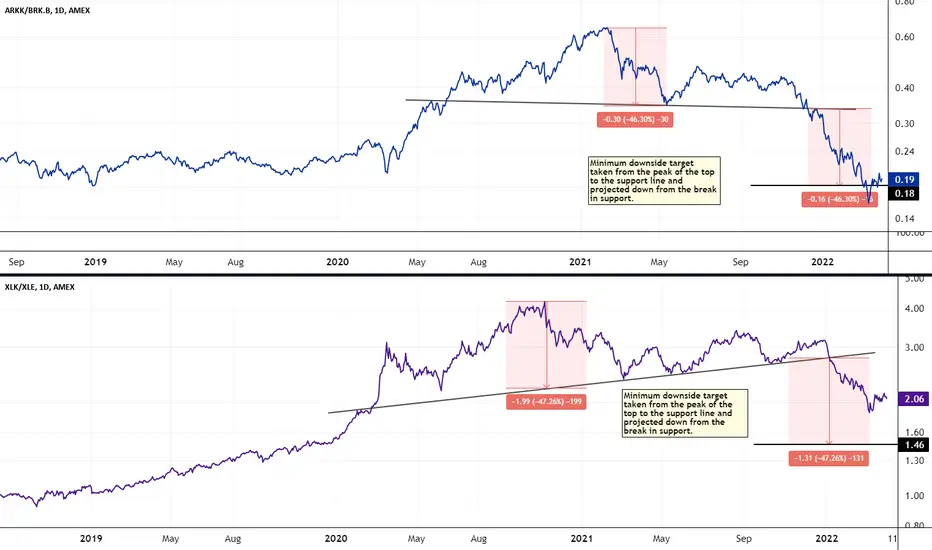
While these two charts aren't the same, they are very similar. The top chart is a ratio chart of ARKK vs Berk.B. The bottom chart is a ratio chart of Tech vs Energy. If the top chart is any indication of the overall trend, then there's plenty of upside in energy still. The downside of ARKK vs BERK.B overshot the minimum downside target. This is a logical area for a bounce. The Tech vs Energy ratio looks to have a ways to go still. These rounded tops are very dependable reversal patterns. Keep your eye open for broken support lines when watching these rounded tops play out.

Publicações relacionadas
Aviso legal
As informações e publicações não se destinam a ser, e não constituem, conselhos ou recomendações financeiras, de investimento, comerciais ou de outro tipo fornecidos ou endossados pela TradingView. Leia mais nos Termos de Uso.
Publicações relacionadas
Aviso legal
As informações e publicações não se destinam a ser, e não constituem, conselhos ou recomendações financeiras, de investimento, comerciais ou de outro tipo fornecidos ou endossados pela TradingView. Leia mais nos Termos de Uso.