
Hello guys,
XLM Chart :
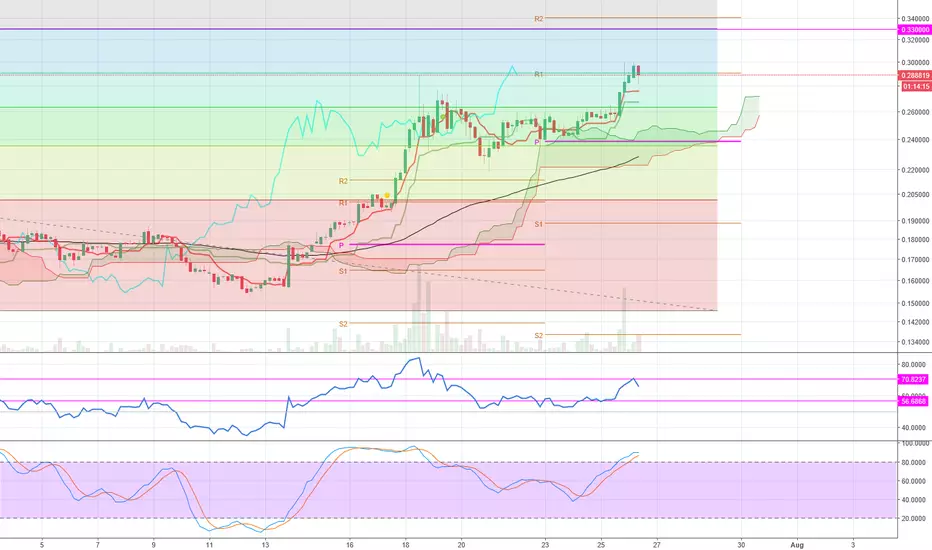
- We hit R1 weekly on H4 chart
- Little pullback on the RSI (21) 70%
- We need to have a signal from a bullish candlestick + break 70% rsi to have a bullish Momentum to go to the weekly R2 and next fibonacci level (0.33€) for a take profit !
Be patient, we need to have a new bullish signal for the next take profit !
XLM Chart :
- We hit R1 weekly on H4 chart
- Little pullback on the RSI (21) 70%
- We need to have a signal from a bullish candlestick + break 70% rsi to have a bullish Momentum to go to the weekly R2 and next fibonacci level (0.33€) for a take profit !
Be patient, we need to have a new bullish signal for the next take profit !

Aviso legal
As informações e publicações não se destinam a ser, e não constituem, conselhos ou recomendações financeiras, de investimento, comerciais ou de outro tipo fornecidos ou endossados pela TradingView. Leia mais nos Termos de Uso.
Aviso legal
As informações e publicações não se destinam a ser, e não constituem, conselhos ou recomendações financeiras, de investimento, comerciais ou de outro tipo fornecidos ou endossados pela TradingView. Leia mais nos Termos de Uso.