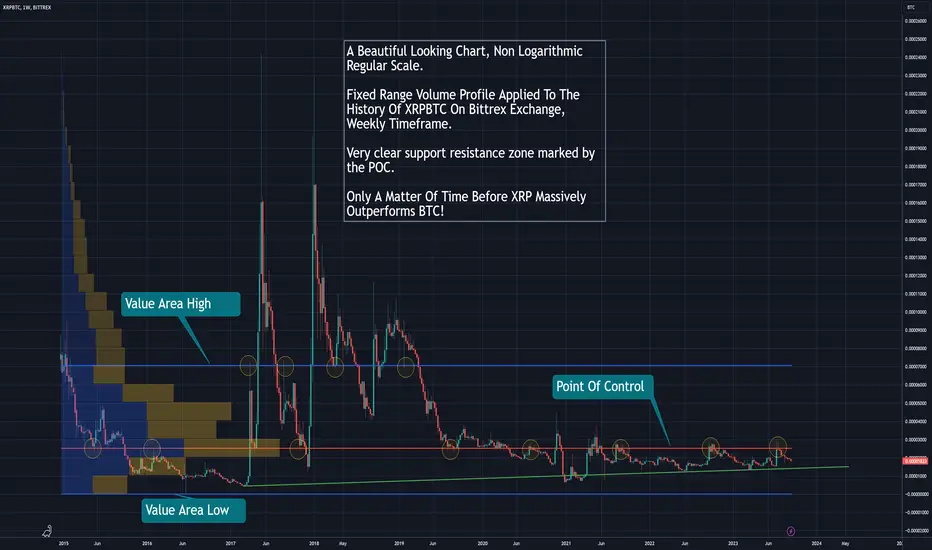
I applied the fixed range volume profile tool to the history of XRPBTC pair on Bittrex on a weekly timeframe. It shows a very well defined clear level of support and resistance formed by the POC.
This has to be the most bullish chart out there. No doubt once XRPBTC breaks out of this zone, it will significantly outperform BTC.
This is a regular scale / nonlogarithmic chart, which I think gives you a better image of what XRP can do once it breaks out of this range.
This has to be the most bullish chart out there. No doubt once XRPBTC breaks out of this zone, it will significantly outperform BTC.
This is a regular scale / nonlogarithmic chart, which I think gives you a better image of what XRP can do once it breaks out of this range.

Publicações relacionadas
Aviso legal
As informações e publicações não se destinam a ser, e não constituem, conselhos ou recomendações financeiras, de investimento, comerciais ou de outro tipo fornecidos ou endossados pela TradingView. Leia mais nos Termos de Uso.
Publicações relacionadas
Aviso legal
As informações e publicações não se destinam a ser, e não constituem, conselhos ou recomendações financeiras, de investimento, comerciais ou de outro tipo fornecidos ou endossados pela TradingView. Leia mais nos Termos de Uso.