
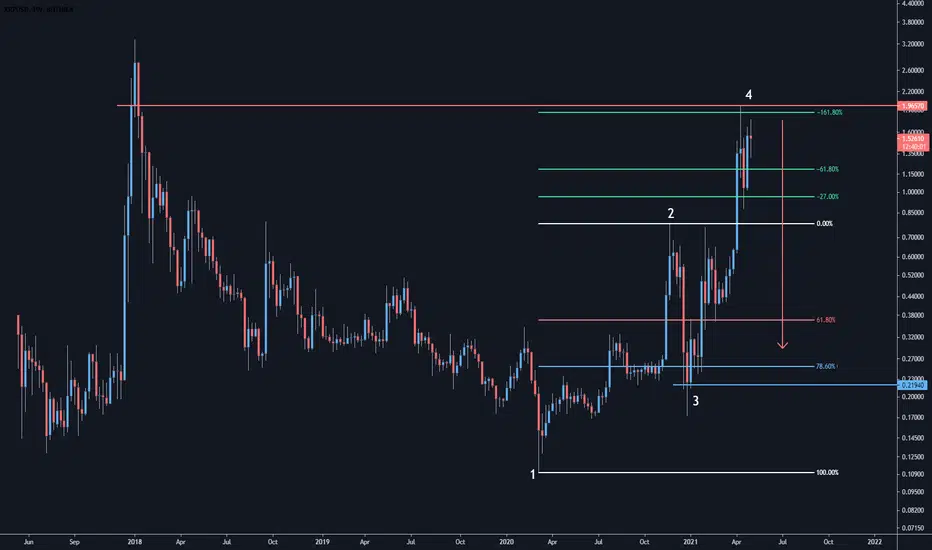
Following the previous post of the Monthly Timeframe, this Weekly Fibonacci further validates why $1.96 is a rejection zone.
The -161.8% Extension aligns with the Dec 2017 / Jan 2018 candle closes where we have tapped it perfectly.
I would anticipate that the next move would be back towards 61.8% and 78.6% retracements where we can identify the next set up.
I will post a Daily Timeframe analysis of this bias to complete the full top-down analysis which shows more confirmations.
The -161.8% Extension aligns with the Dec 2017 / Jan 2018 candle closes where we have tapped it perfectly.
I would anticipate that the next move would be back towards 61.8% and 78.6% retracements where we can identify the next set up.
I will post a Daily Timeframe analysis of this bias to complete the full top-down analysis which shows more confirmations.
Nota
Monthly Analysis - 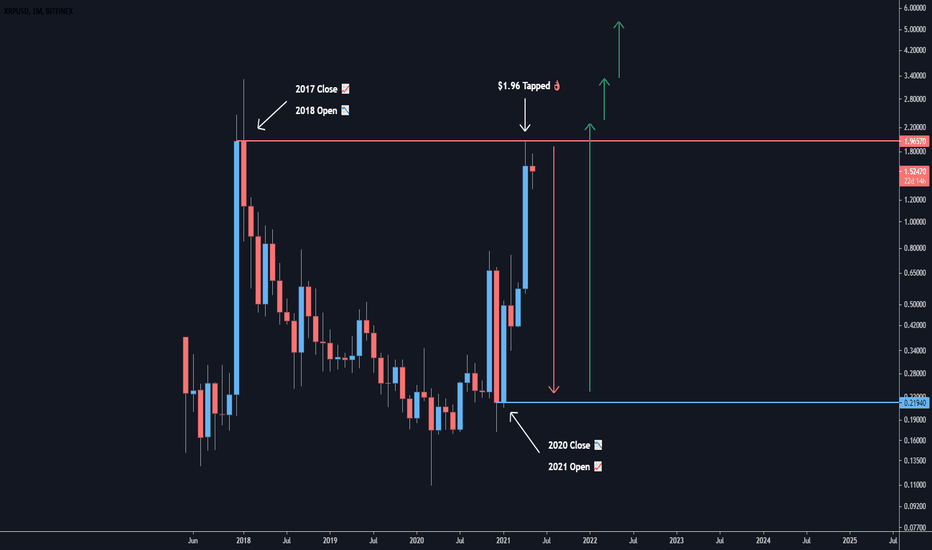
Nota
Daily Analysis - 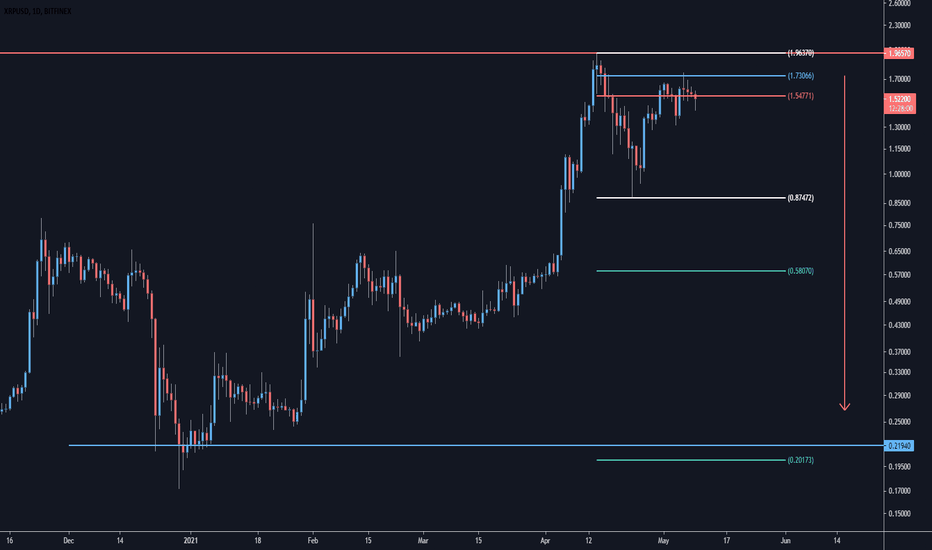

Aviso legal
As informações e publicações não se destinam a ser, e não constituem, conselhos ou recomendações financeiras, de investimento, comerciais ou de outro tipo fornecidos ou endossados pela TradingView. Leia mais nos Termos de Uso.
Aviso legal
As informações e publicações não se destinam a ser, e não constituem, conselhos ou recomendações financeiras, de investimento, comerciais ou de outro tipo fornecidos ou endossados pela TradingView. Leia mais nos Termos de Uso.