
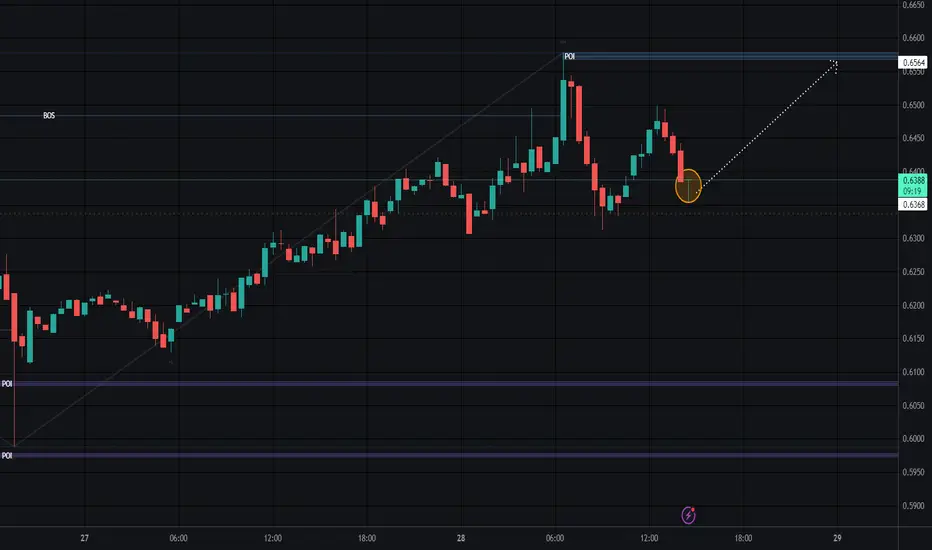
Judging by this candlestick, the neat chart pattern formation indicate a strong bullish momentum, as well as a clear support and resistance zone. I expect a retest of the 0.6570 resistance soon. If it breaks and holds, we’ll be heading towards the next target at 0.6680, followed by the 0.70 and 0.73 levels that we saw on Nov 23rd.
My theory . . . when price breaks and holds above that line, the bulls are going to have an epic rally up the chart!
Only time will tell. Please share your thoughts, opinions, predictions, criticisms, etc.
My theory . . . when price breaks and holds above that line, the bulls are going to have an epic rally up the chart!
Only time will tell. Please share your thoughts, opinions, predictions, criticisms, etc.

Aviso legal
As informações e publicações não se destinam a ser, e não constituem, conselhos ou recomendações financeiras, de investimento, comerciais ou de outro tipo fornecidos ou endossados pela TradingView. Leia mais nos Termos de Uso.
Aviso legal
As informações e publicações não se destinam a ser, e não constituem, conselhos ou recomendações financeiras, de investimento, comerciais ou de outro tipo fornecidos ou endossados pela TradingView. Leia mais nos Termos de Uso.