WTI Crude Oil (XTIUSD): Multi-Timeframe Alignment Signals Bearish Expansion Toward Daily 200 EMA
### 🛢️ WTI Crude Oil (XTIUSD) Technical Study (Ref: XTIUSD_2026-06-11_09-17-13.png & XTIUSD_2026-06-11_09-21-03.png)
We are publishing a comprehensive multi-timeframe structural analysis on WTI Light Crude Oil ( XTIUSD - IC Markets), highlighting a highly confluent bearish expansion path as both the Daily and 4-Hour charts align.
### 1. The Daily Macro Picture (Ref: XTIUSD_2026-06-11_09-17-13.png)
* **Dynamic Breakdown:** On the 1D timeframe, price action has officially sustained acceptance below the **72-period EMA (red line at 92.13)**, confirming a clear shift in medium-term order flow.
* **The Downside Magnet:** Our bearish vector points directly toward a high-probability institutional demand pocket. This layer is anchored by a major historical horizontal support line at **82.32**, which sits just above the long-term **200-period EMA (blue line at 80.34)**. This projected correction measures roughly a **-10.28% move** from the breakdown trigger.
### 2. The 4-Hour Intraday Confluence (Ref: XTIUSD_2026-06-11_09-21-03.png)
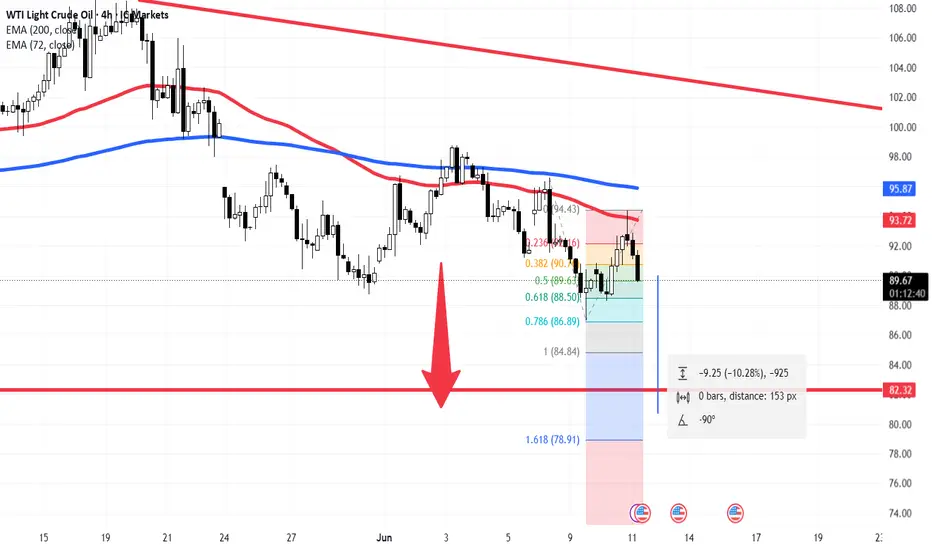
* **Fibonacci Geometry:** Dropping down to the 4H chart, the intraday structure fully substantiates the macro directional bias. Following a minor corrective bounce that stalled beneath the descending trendline, sellers stepped back in aggressively near the local Fibonacci clusters.
* **The Expansion Vector:** Price is currently trading at **90.04**, targeting the lower Fibonacci extensions. A clean breach of the local structure opens up a fast liquidity vacuum directly into the **1.618 Fib extension layer at 78.91**, which flanks and secures the lower boundary of our Daily 200 EMA target zone.
### Tactical Strategy:
The structural bias on Crude Oil remains firmly defensive. Any short-term intraday pullbacks toward the 92.00–93.50 region (confluence of the 4H EMAs and broken Daily 72 EMA) are to be viewed as potential lower-high distribution zones for continuation plays. Our primary macro target area remains focused on the **82.32–80.34 key support cluster**, where we anticipate significant institutional profit-taking and potential structural stabilization.
---
📊 **ChartPro Data** | By Rogerio Zaglia
*Systematic Commodity Research, Price Action Confluences & Multi-Timeframe Analysis.*
⚠️ **Disclaimer:** For educational and informational purposes only. This chart study represents a personal trading framework and does not constitute financial or investment advice.
### 🛢️ WTI Crude Oil (XTIUSD) Technical Study (Ref: XTIUSD_2026-06-11_09-17-13.png & XTIUSD_2026-06-11_09-21-03.png)
We are publishing a comprehensive multi-timeframe structural analysis on WTI Light Crude Oil (
XTIUSD - IC Markets), highlighting a highly confluent bearish expansion path as both the Daily and 4-Hour charts align.### 1. The Daily Macro Picture (Ref: XTIUSD_2026-06-11_09-17-13.png)
* **Dynamic Breakdown:** On the 1D timeframe, price action has officially sustained acceptance below the **72-period EMA (red line at 92.13)**, confirming a clear shift in medium-term order flow.
* **The Downside Magnet:** Our bearish vector points directly toward a high-probability institutional demand pocket. This layer is anchored by a major historical horizontal support line at **82.32**, which sits just above the long-term **200-period EMA (blue line at 80.34)**. This projected correction measures roughly a **-10.28% move** from the breakdown trigger.
### 2. The 4-Hour Intraday Confluence (Ref: XTIUSD_2026-06-11_09-21-03.png)
* **Fibonacci Geometry:** Dropping down to the 4H chart, the intraday structure fully substantiates the macro directional bias. Following a minor corrective bounce that stalled beneath the descending trendline, sellers stepped back in aggressively near the local Fibonacci clusters.
* **The Expansion Vector:** Price is currently trading at **90.04**, targeting the lower Fibonacci extensions. A clean breach of the local structure opens up a fast liquidity vacuum directly into the **1.618 Fib extension layer at 78.91**, which flanks and secures the lower boundary of our Daily 200 EMA target zone.
### Tactical Strategy:
The structural bias on Crude Oil remains firmly defensive. Any short-term intraday pullbacks toward the 92.00–93.50 region (confluence of the 4H EMAs and broken Daily 72 EMA) are to be viewed as potential lower-high distribution zones for continuation plays. Our primary macro target area remains focused on the **82.32–80.34 key support cluster**, where we anticipate significant institutional profit-taking and potential structural stabilization.
---
📊 **ChartPro Data** | By Rogerio Zaglia
*Systematic Commodity Research, Price Action Confluences & Multi-Timeframe Analysis.*
⚠️ **Disclaimer:** For educational and informational purposes only. This chart study represents a personal trading framework and does not constitute financial or investment advice.

Aviso legal
As informações e publicações não se destinam a ser, e não constituem, conselhos ou recomendações financeiras, de investimento, comerciais ou de outro tipo fornecidos ou endossados pela TradingView. Leia mais nos Termos de Uso.
Aviso legal
As informações e publicações não se destinam a ser, e não constituem, conselhos ou recomendações financeiras, de investimento, comerciais ou de outro tipo fornecidos ou endossados pela TradingView. Leia mais nos Termos de Uso.