
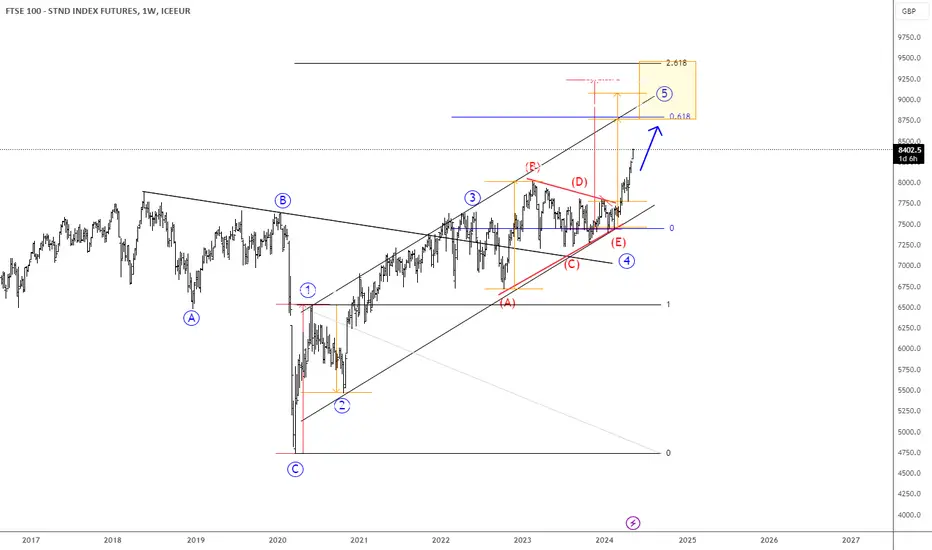
We have been talking for a long time about bullish UK stock market index FTSE100 a.k.a. Footsie. We also shared the chart with our members more than a year ago, where we were tracking wave 4 correction within an ongoing five-wave bullish impulse.
After a longer sideways consolidation, it turned out to be a bullish triangle pattern in wave 4, but as you can see, it’s now finally and nicely extending higher for wave 5 as expected. There can be space even up to 8800 – 9400 target area, just watch out on short-term pullbacks.
After a longer sideways consolidation, it turned out to be a bullish triangle pattern in wave 4, but as you can see, it’s now finally and nicely extending higher for wave 5 as expected. There can be space even up to 8800 – 9400 target area, just watch out on short-term pullbacks.

Join the community and get access to our analysis >> @ wavetraders.com/
Learn Elliott Waves Sale-65%
👉 wavetraders.com/academy/
Newsletter
👉 bit.ly/3FVPVzO
Learn Elliott Waves Sale-65%
👉 wavetraders.com/academy/
Newsletter
👉 bit.ly/3FVPVzO
Publicações relacionadas
Aviso legal
As informações e publicações não se destinam a ser, e não constituem, conselhos ou recomendações financeiras, de investimento, comerciais ou de outro tipo fornecidos ou endossados pela TradingView. Leia mais nos Termos de Uso.
Join the community and get access to our analysis >> @ wavetraders.com/
Learn Elliott Waves Sale-65%
👉 wavetraders.com/academy/
Newsletter
👉 bit.ly/3FVPVzO
Learn Elliott Waves Sale-65%
👉 wavetraders.com/academy/
Newsletter
👉 bit.ly/3FVPVzO
Publicações relacionadas
Aviso legal
As informações e publicações não se destinam a ser, e não constituem, conselhos ou recomendações financeiras, de investimento, comerciais ou de outro tipo fornecidos ou endossados pela TradingView. Leia mais nos Termos de Uso.