
The Long Bond and the Shifting Inflation Narrative
The ZB thirty year Treasury futures contract represents the long end of the United States Treasury yield curve and is primarily driven by expectations around inflation, growth, fiscal policy, and long term interest rate risk. Because of its long duration, ZB is the most sensitive Treasury product to changes in inflation expectations and shifts in term premium. When markets become concerned about persistent inflation or increased Treasury issuance, ZB tends to underperform. When growth risks rise or inflation pressures ease, ZB often attracts defensive demand.
Within the Treasury complex, ZB sits at the far end of the curve, while ZT two year, ZF five year, and ZN ten year futures reflect progressively shorter duration exposures. ZT is most reactive to Federal Reserve policy expectations, ZN tends to balance policy and growth considerations, and ZB expresses longer term confidence or concern about economic stability and inflation control. Over the past few months, sentiment in ZB has improved as inflation has moderated from prior highs and recession risks have remained present but not fully realized. The narrative since late spring has centered on easing tariff fears, slower but resilient growth, and a market that is gradually reassessing how restrictive policy needs to remain over the long run.
This week, macro data will be a major driver. CPI on January 13th, followed by PPI and retail sales on January 14th, will shape near term direction. A miss in CPI or PPI, particularly on core measures, would likely support ZB as it reinforces the idea that long term inflation pressures are cooling, allowing yields to drift lower. A beat in inflation or strong retail sales would pressure ZB lower, as it would revive concerns that growth and pricing power remain too firm for comfort at the long end of the curve.
What the Market has done
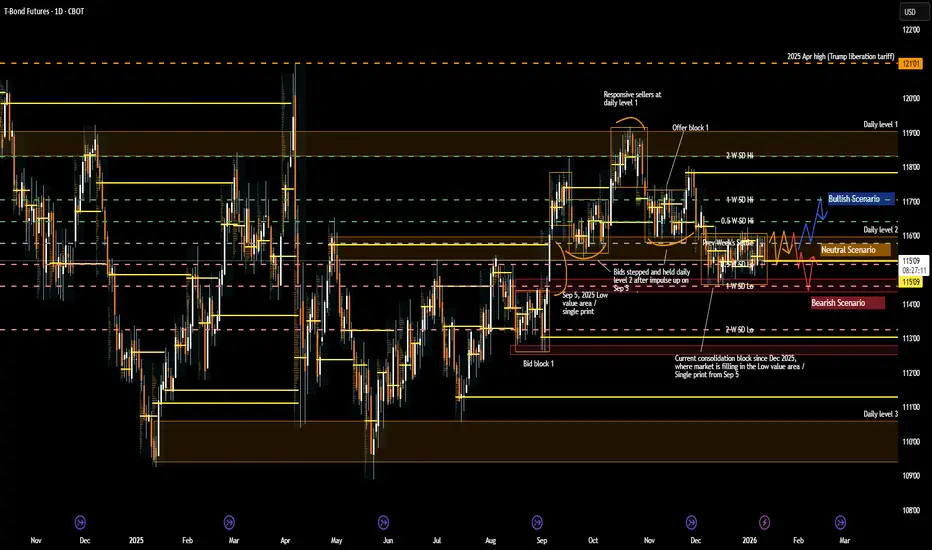
• Since bottoming out at the 109'14 area in May 2025 after tariff fears were alleviated, bids have stepped up and the market has steadily reclaimed the April Trump liberation tariff selloff.
• In September 2025, buyers were able to overcome sellers at 116’00, which was daily level 2 and a four month resistance level where sellers had previously defended.
• Subsequently, buyers were able to defend this level until the end of November, when bids slipped and sellers were able to offer prices down through the September 5, 2025 low value area and single print at 115'20 to 114'20.
• Since December, the market has been consolidating sideways within this zone, filling in and repairing the LVA as balance has developed.
What to expect in the coming week
The key level to watch is 115'25 to 116'00, which represents the previous week’s close, the current consolidation block high, and the over-under zone of daily level 2.
Neutral scenario
• Expect the market to continue consolidating in a tight range, potentially between 115'25 and 115'05, as participants wait for clarity from CPI on January 13th and PPI and retail sales on January 14th.
• In this scenario, rotational and mean reverting behavior should dominate, with responsive buyers and sellers active at range extremes.
Bearish scenario
• If the market is unable to accept above 116'00, expect a rotation back down through the consolidation block toward 114'18, which aligns with the range low and weekly one standard deviation low.
• This bearish scenario is likely to be very choppy and difficult to trade, as the market remains in balance within the broader 116 to 114'20 range.
Bullish scenario
• If the market is able to accept above 116'00, price could move up through offer block 1 toward 117'00, which represents the high of offer block 1 and the weekly one standard deviation high.
• In our opinion, this is the cleaner trade opportunity, as the market would be imbalancing out of the current balanced and composite value area, opening the door for directional follow through.
Conclusion
ZB sits at a critical decision point, balancing between a well repaired value area below and a clearly defined acceptance zone above. With CPI scheduled for January 13th, followed by PPI and retail sales on January 14th, the market is likely to remain patient until these releases provide clarity on inflation persistence and demand strength. A softer inflation print or weaker consumption data would support acceptance higher and reinforce the bullish imbalance scenario, while firmer data could keep ZB capped and pressure price back through the current consolidation. In our opinion, traders should focus on how price responds at 116'00 and 115'25 following the releases, as acceptance or rejection at these levels will likely define the next directional opportunity.
If you found this analysis useful, feel free to give a boost, comment, or share your own levels and scenarios below.
Disclaimer: This is not financial advice. Analysis is for educational purposes only; trade your own plan and manage risk.
Acronyms:
w - Weekly
VAH - Value Area High
VAL - Value Area Low
VPOC - Volume Point of Control
LVN - Low Value Node
HVN - High Value Node
LVA - Low Value Area
SP - Single print
The ZB thirty year Treasury futures contract represents the long end of the United States Treasury yield curve and is primarily driven by expectations around inflation, growth, fiscal policy, and long term interest rate risk. Because of its long duration, ZB is the most sensitive Treasury product to changes in inflation expectations and shifts in term premium. When markets become concerned about persistent inflation or increased Treasury issuance, ZB tends to underperform. When growth risks rise or inflation pressures ease, ZB often attracts defensive demand.
Within the Treasury complex, ZB sits at the far end of the curve, while ZT two year, ZF five year, and ZN ten year futures reflect progressively shorter duration exposures. ZT is most reactive to Federal Reserve policy expectations, ZN tends to balance policy and growth considerations, and ZB expresses longer term confidence or concern about economic stability and inflation control. Over the past few months, sentiment in ZB has improved as inflation has moderated from prior highs and recession risks have remained present but not fully realized. The narrative since late spring has centered on easing tariff fears, slower but resilient growth, and a market that is gradually reassessing how restrictive policy needs to remain over the long run.
This week, macro data will be a major driver. CPI on January 13th, followed by PPI and retail sales on January 14th, will shape near term direction. A miss in CPI or PPI, particularly on core measures, would likely support ZB as it reinforces the idea that long term inflation pressures are cooling, allowing yields to drift lower. A beat in inflation or strong retail sales would pressure ZB lower, as it would revive concerns that growth and pricing power remain too firm for comfort at the long end of the curve.
What the Market has done
• Since bottoming out at the 109'14 area in May 2025 after tariff fears were alleviated, bids have stepped up and the market has steadily reclaimed the April Trump liberation tariff selloff.
• In September 2025, buyers were able to overcome sellers at 116’00, which was daily level 2 and a four month resistance level where sellers had previously defended.
• Subsequently, buyers were able to defend this level until the end of November, when bids slipped and sellers were able to offer prices down through the September 5, 2025 low value area and single print at 115'20 to 114'20.
• Since December, the market has been consolidating sideways within this zone, filling in and repairing the LVA as balance has developed.
What to expect in the coming week
The key level to watch is 115'25 to 116'00, which represents the previous week’s close, the current consolidation block high, and the over-under zone of daily level 2.
Neutral scenario
• Expect the market to continue consolidating in a tight range, potentially between 115'25 and 115'05, as participants wait for clarity from CPI on January 13th and PPI and retail sales on January 14th.
• In this scenario, rotational and mean reverting behavior should dominate, with responsive buyers and sellers active at range extremes.
Bearish scenario
• If the market is unable to accept above 116'00, expect a rotation back down through the consolidation block toward 114'18, which aligns with the range low and weekly one standard deviation low.
• This bearish scenario is likely to be very choppy and difficult to trade, as the market remains in balance within the broader 116 to 114'20 range.
Bullish scenario
• If the market is able to accept above 116'00, price could move up through offer block 1 toward 117'00, which represents the high of offer block 1 and the weekly one standard deviation high.
• In our opinion, this is the cleaner trade opportunity, as the market would be imbalancing out of the current balanced and composite value area, opening the door for directional follow through.
Conclusion
ZB sits at a critical decision point, balancing between a well repaired value area below and a clearly defined acceptance zone above. With CPI scheduled for January 13th, followed by PPI and retail sales on January 14th, the market is likely to remain patient until these releases provide clarity on inflation persistence and demand strength. A softer inflation print or weaker consumption data would support acceptance higher and reinforce the bullish imbalance scenario, while firmer data could keep ZB capped and pressure price back through the current consolidation. In our opinion, traders should focus on how price responds at 116'00 and 115'25 following the releases, as acceptance or rejection at these levels will likely define the next directional opportunity.
If you found this analysis useful, feel free to give a boost, comment, or share your own levels and scenarios below.
Disclaimer: This is not financial advice. Analysis is for educational purposes only; trade your own plan and manage risk.
Acronyms:
w - Weekly
VAH - Value Area High
VAL - Value Area Low
VPOC - Volume Point of Control
LVN - Low Value Node
HVN - High Value Node
LVA - Low Value Area
SP - Single print

EdgeClear
P: 773.832.8320
Derivatives trading involves a substantial risk of loss. Past performance is not indicative of future results. Any example trades are not inclusive of fees and commissions.
P: 773.832.8320
Derivatives trading involves a substantial risk of loss. Past performance is not indicative of future results. Any example trades are not inclusive of fees and commissions.
Aviso legal
As informações e publicações não se destinam a ser, e não constituem, conselhos ou recomendações financeiras, de investimento, comerciais ou de outro tipo fornecidos ou endossados pela TradingView. Leia mais nos Termos de Uso.
Aviso legal
As informações e publicações não se destinam a ser, e não constituem, conselhos ou recomendações financeiras, de investimento, comerciais ou de outro tipo fornecidos ou endossados pela TradingView. Leia mais nos Termos de Uso.